Urban Climate Patterns: Analysis of Urban Heat Islands
INFO 523 - Fall 2023 - Project Final
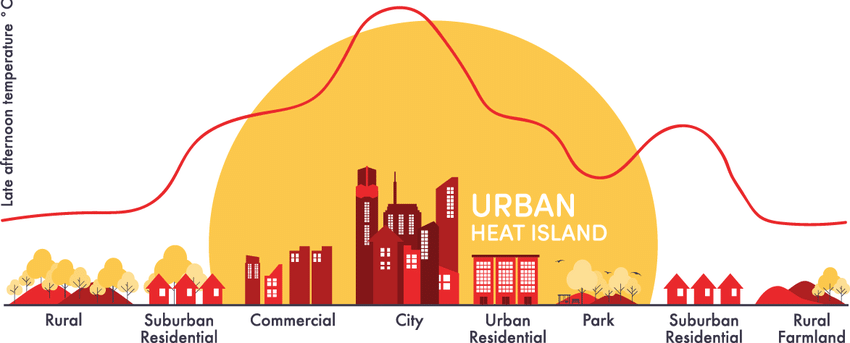
UHI Definition
- A UHI (“Urban Heat Island”) occurs when a city experiences much warmer temperatures than nearby rural areas.
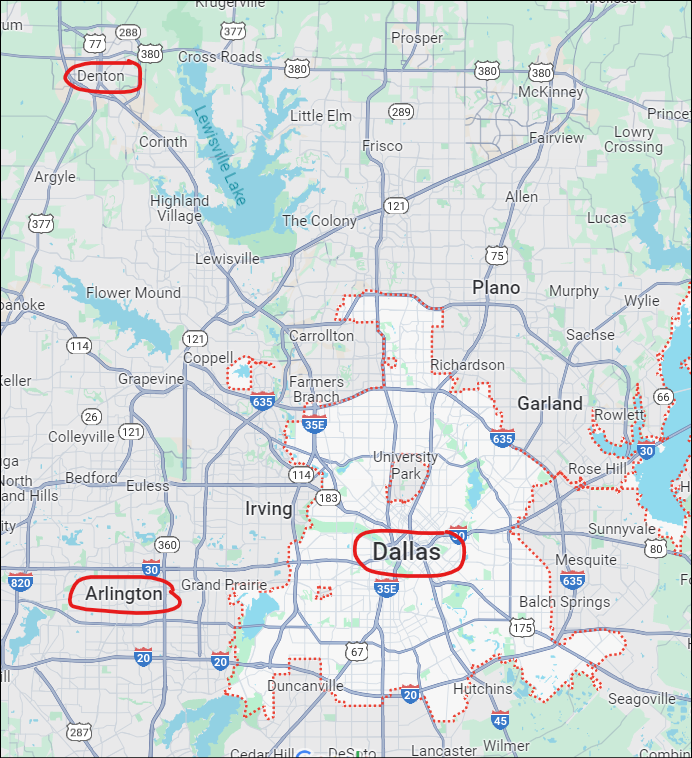
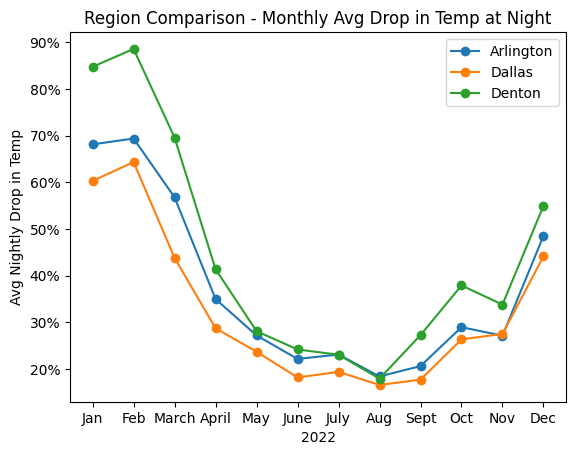
3 Cities for UHI Comparison
Dallas vs. Arlington vs. Denton
Exploratory Data Analysis (EDA)
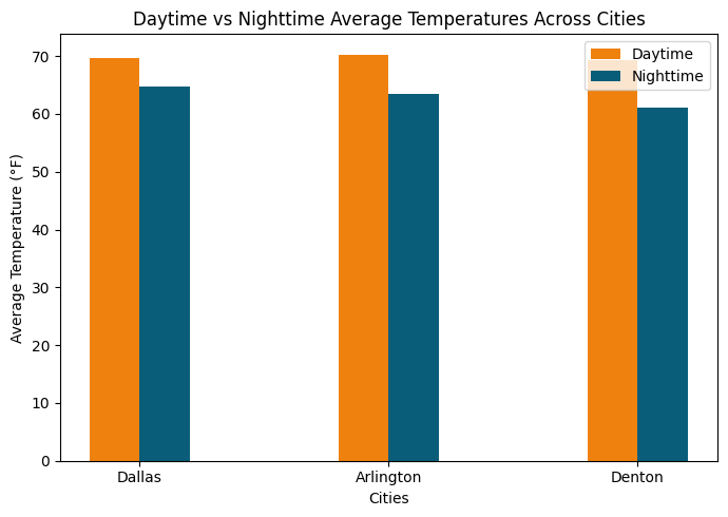
Exploratory Data Analysis (EDA)
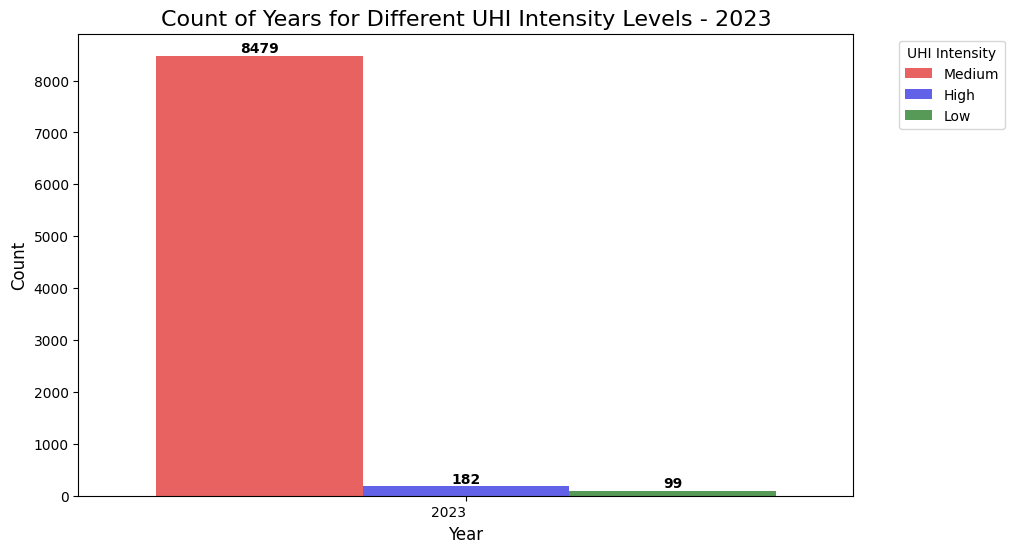
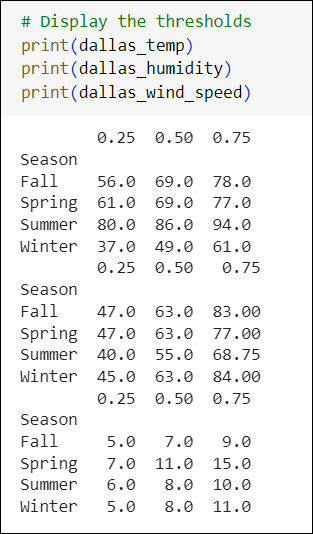
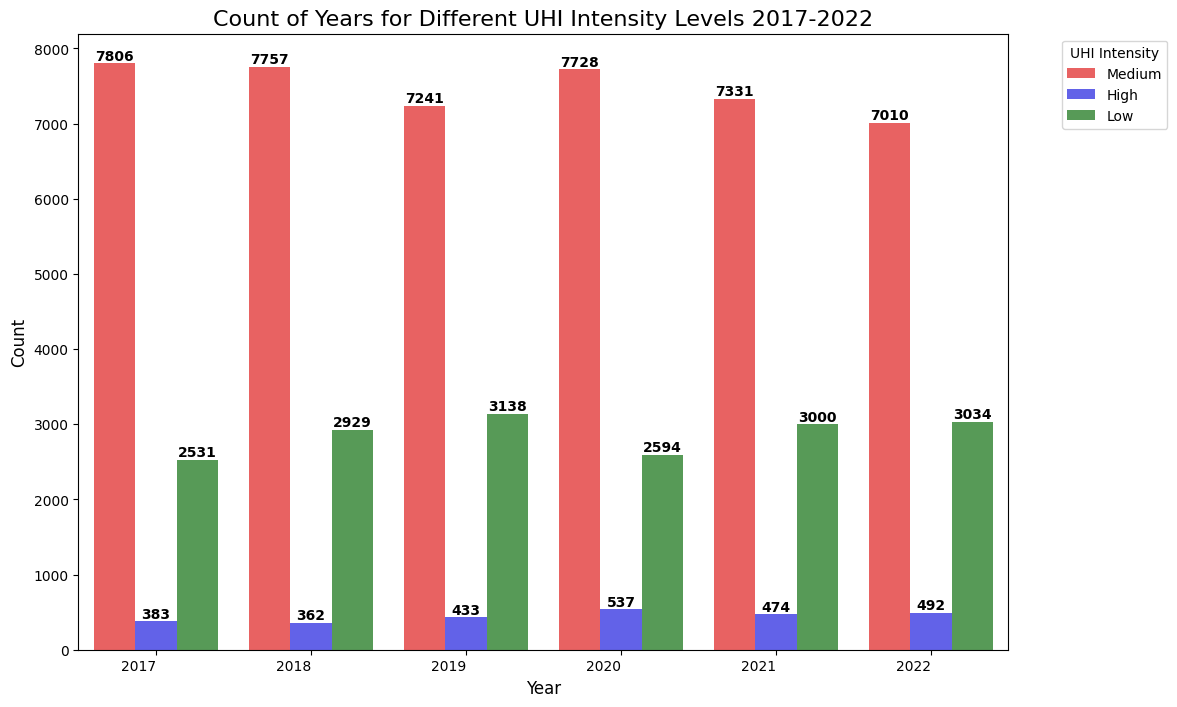
Create Seasonal Thresholds
Results of Classification Function

Classification Model Results
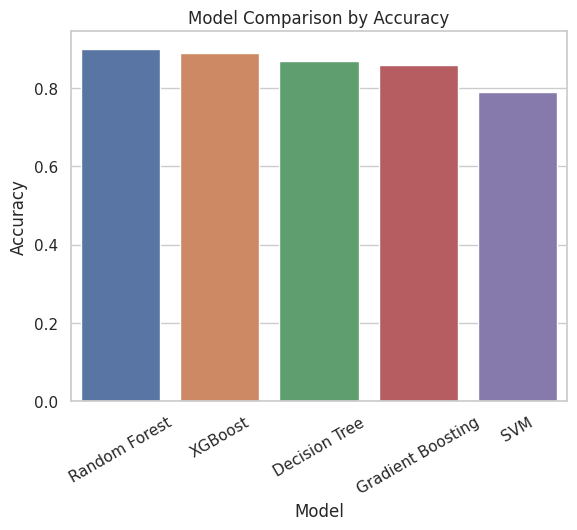
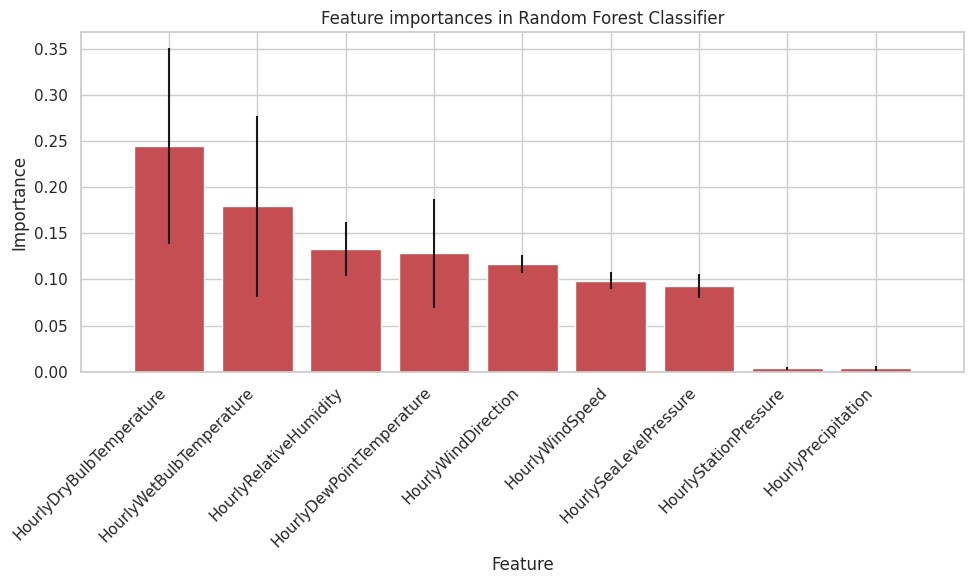
Random Forest
rfc_model = RandomForestClassifier()
rfc_model.fit(X_train, y_train)

y_pred = rfc_model.predict(X_test)
print(classification_report(y_test, y_pred))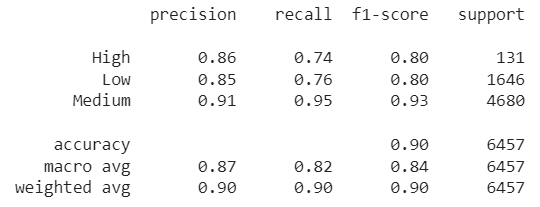
Additional Evaluation of Random Forest
Time Series Analysis
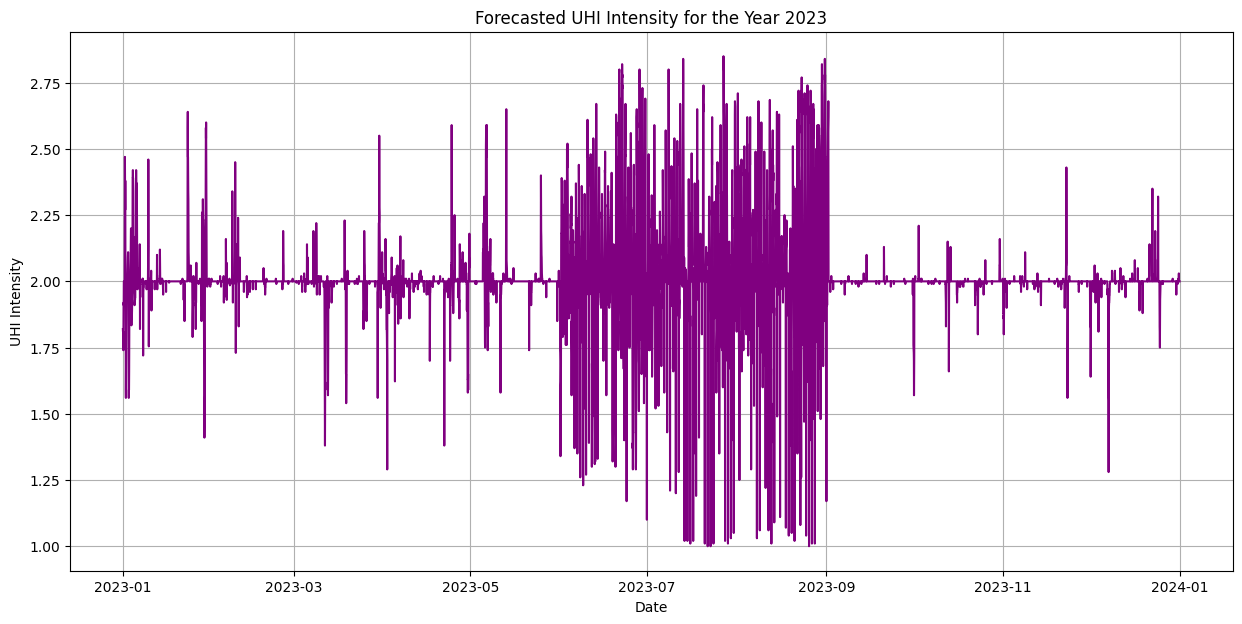
Time Series Analysis
Time Series Analysis