Seeing the Unseen

Seeing the Unseen: Predicting Brain Stroke

Authors:

  • Abhishek Deore

  • Daniel Shevelev

  • Kashyap Nadendla

  • Shreya Kolte

  • Ram Dheeraj Kamarajugadda

Dataset Description

  • The Brain Stroke Dataset is taken from Kaggle datasets and consists of 4982 rows and 11 columns.
  • Gender, age, hypertension, average glucose level, smoking status, stroke, ever married,work type, residence type
  • No null values were to be found in the dataset

EDA Plots

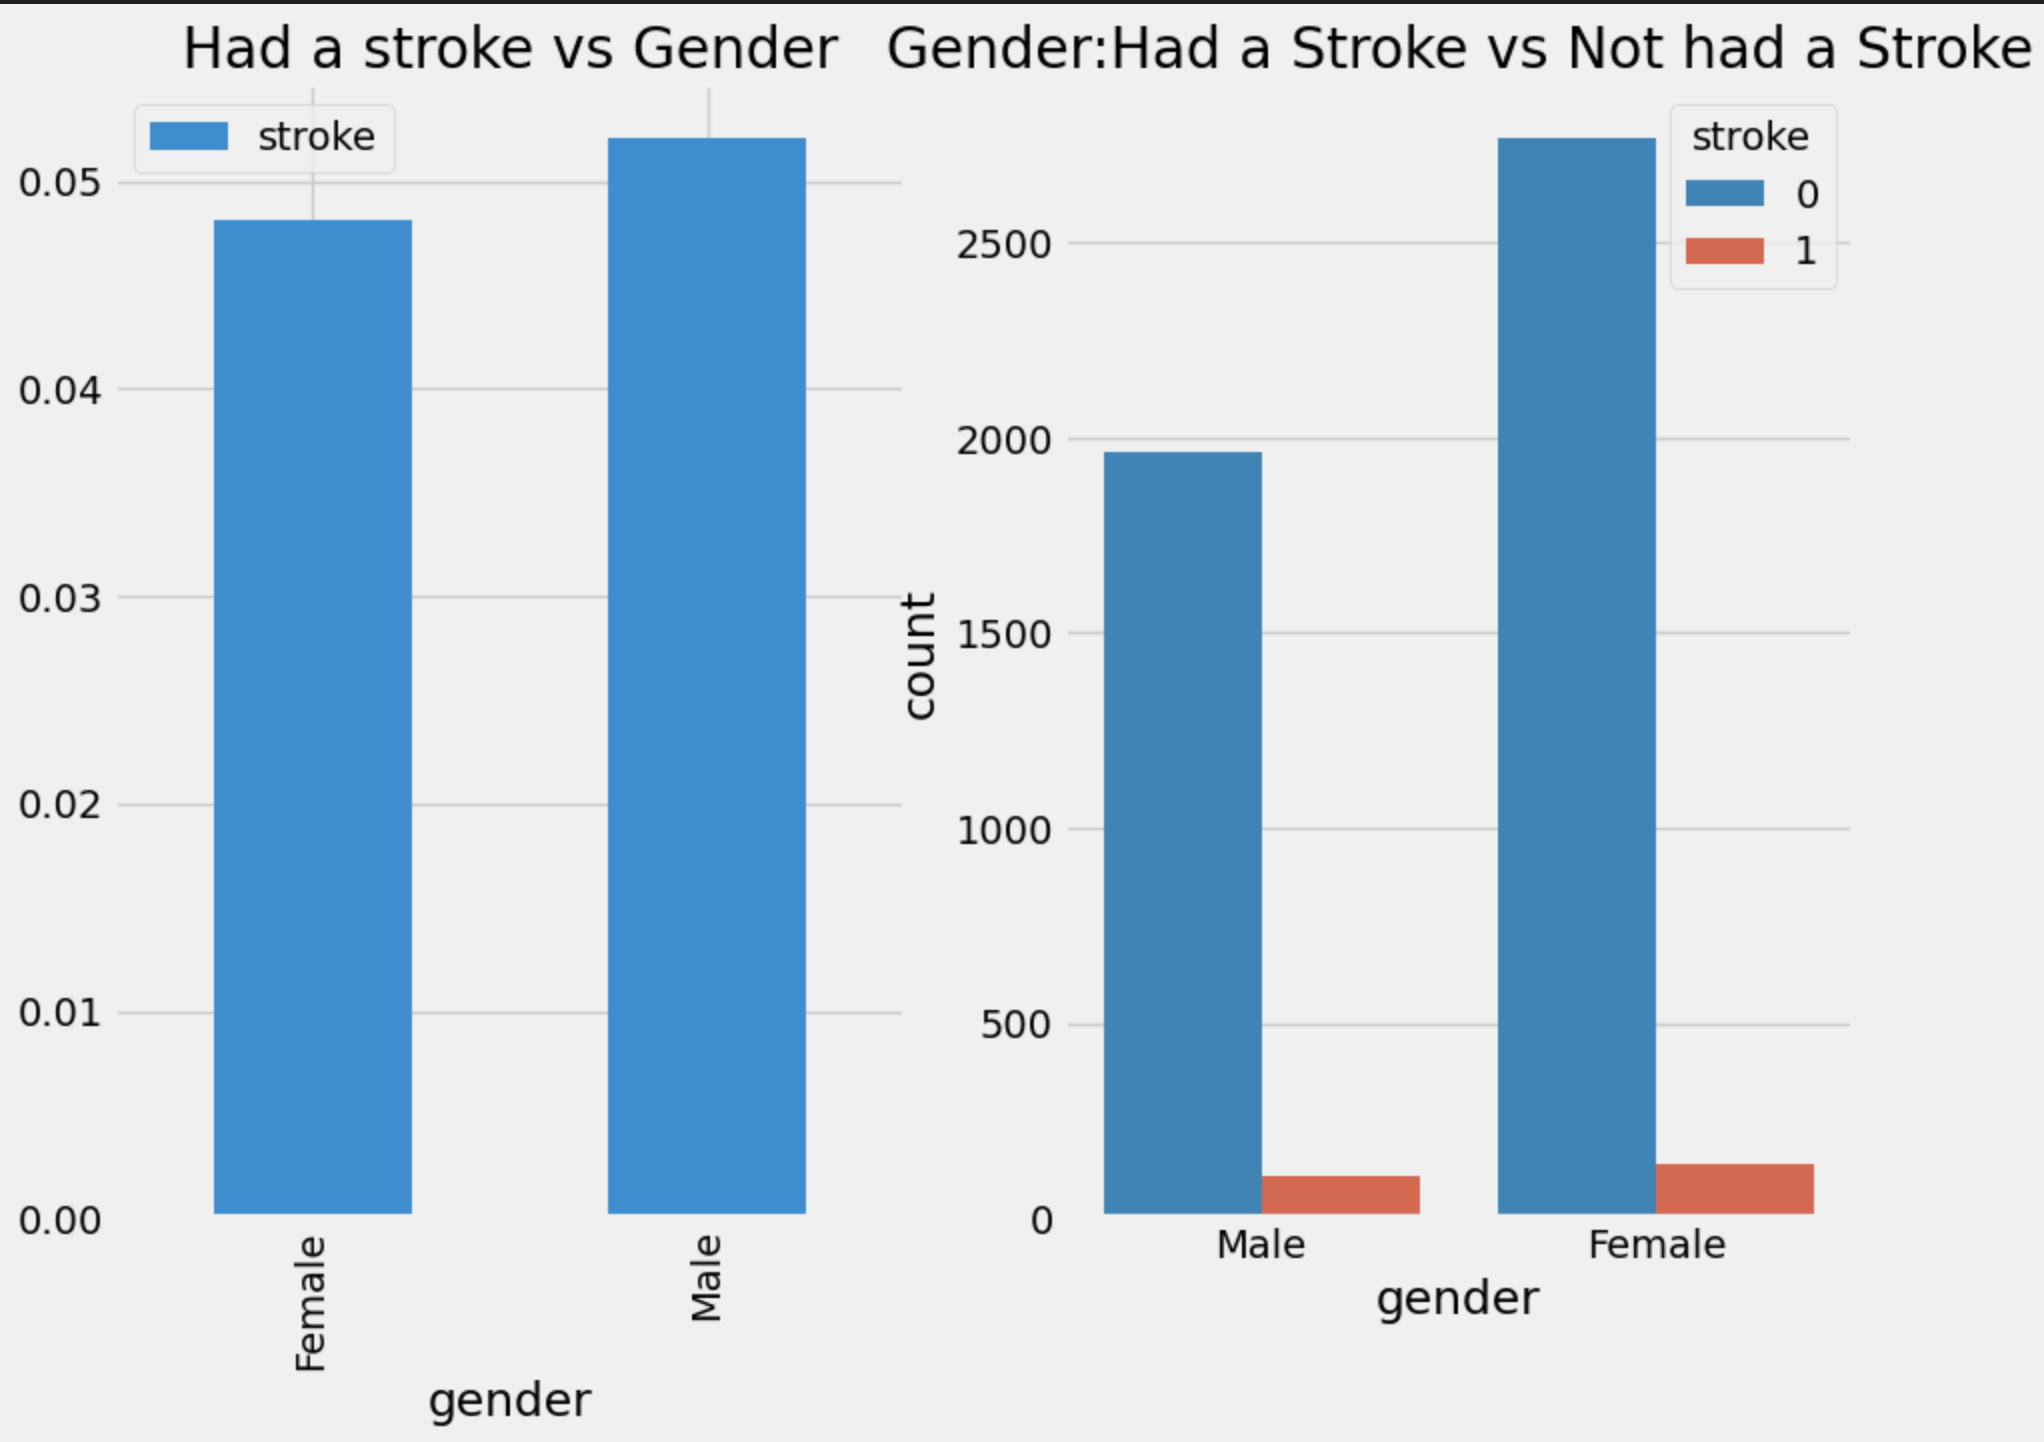
  • Gender

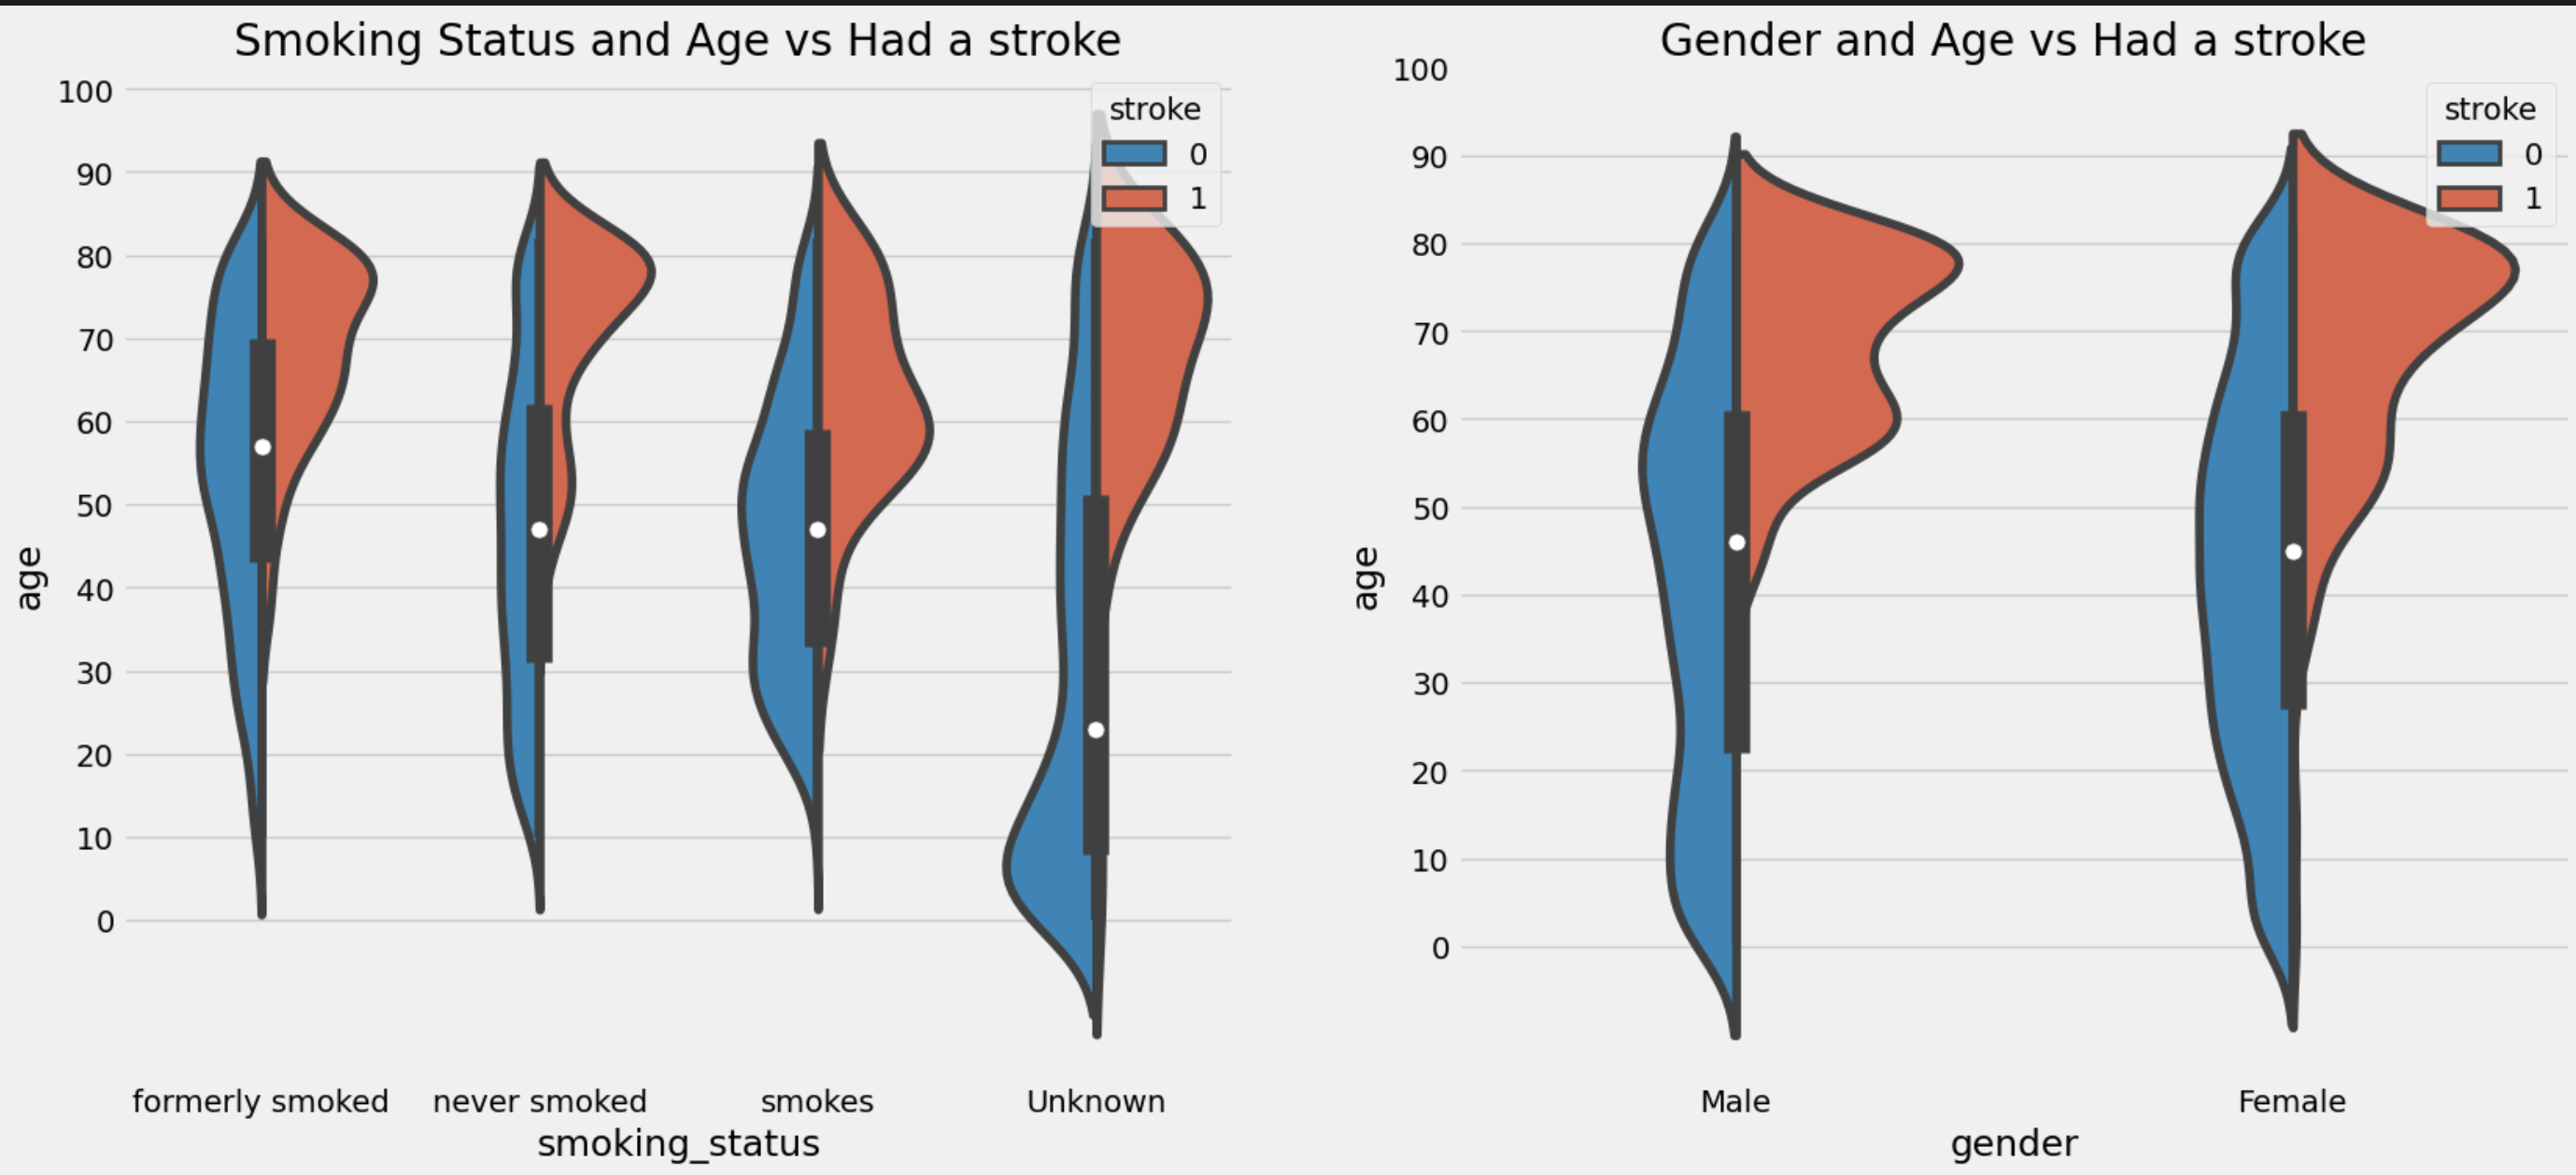
  • Smoking status and age relation

  • Age vs average glucose level

  • Heart disease and strokes

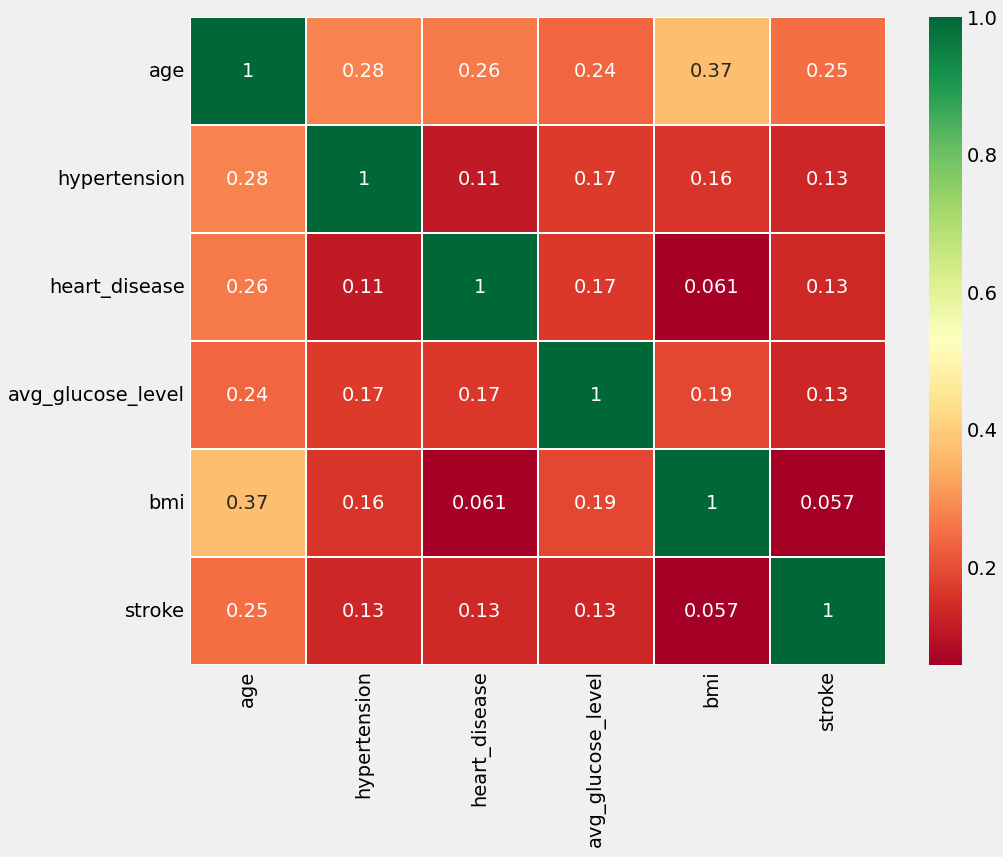
  • Correlation Heat Map

Gender

Smoking Status and Age relation
Age vs Glucose

Heart Disease and Strokes

Correlation Heat Map

  • This heatmap is useful for identifying potential patterns and relationships between different numeric variables in the dataset.
Question 1 : How accurate are various classification models for detecting a stroke in a patient?

Approach

  • In the initial phase of our brain stroke prediction project, we conducted a comprehensive examination of the dataset. The brain.shape and brain.info() checks ensured the dataset’s integrity, revealing its dimensions and basic information.

Classification models used:

  • Logistic Regression

  • K-Nearest Neighbors (KNN)

  • Naive Bayes

  • Decision Tree

  • Random Forest

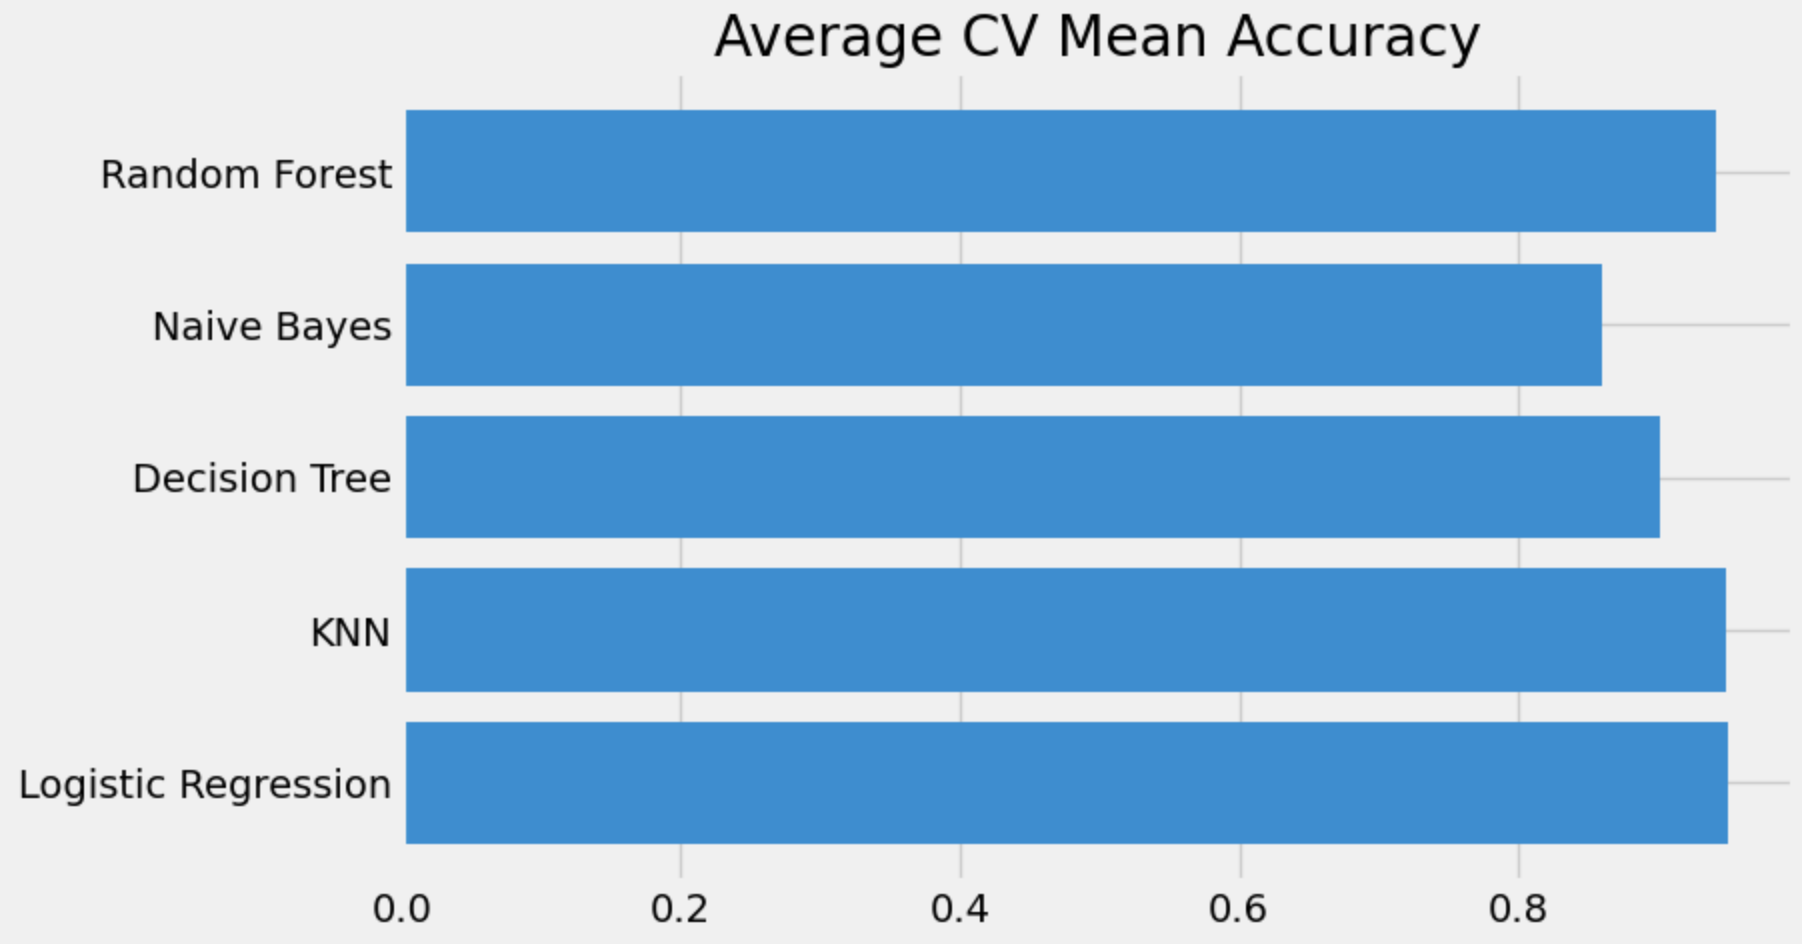
Model Accuracy Results

Selected Model:

Logistic Regression

  • Accuracy - 95%

Question 2: How are certain lifestyle changes ranked on the basis of their importance in reducing the possibility of a stroke?

Approach

  • The feature ranking provided by the logistic regression model with their corresponding coefficients gives insights into the impact of each feature on the likelihood of the target variable.

Feature ranking :

Feature Coefficient
age_band 1.187519
avg_glucose_level 0.880860
hypertension 0.551390
heart_diesease 0.288187
gender 0.073007
smoking_status -0.053451
bmi -0.211967

Here’s an interpretation of the feature ranking :

  • Age is a big factor in stroke and has a positive coefficient above 1.

  • Average glucose level is the second most significant feature with a coefficient of 0.88

  • BMI coefficient is -0.21. Higher BMI is associated with lower likelihood of the target variable.

Challenges faced

  • Class imbalance where one class (e.g stroke) significantly outnumbers the other, chances of leading to biased models

  • Choosing an appropriate model that balances complexity and interpretability

THANK YOU