| age | gender | purchase_frequency | purchase_categories | personalized_recommendation_frequency_6 | browsing_frequency | product_search_method | search_result_exploration | customer_reviews_importance | add_to_cart_browsing | cart_completion_frequency | cart_abandonment_factors | saveforlater_frequency | review_left | review_reliability | review_helpfulness | personalized_recommendation_frequency_18 | recommendation_helpfulness | rating_accuracy | shopping_satisfaction | service_appreciation | improvement_areas | grouped_improvement_areas |
|---|---|---|---|---|---|---|---|---|---|---|---|---|---|---|---|---|---|---|---|---|---|---|
| 23 | Female | Few times a month | Beauty and Personal Care | Yes | Few times a week | Keyword | Multiple pages | 1 | Yes | Sometimes | Found a better price elsewhere | Sometimes | Yes | Occasionally | Yes | 2 | Yes | 1 | 1 | Competitive prices | Reducing packaging waste | Reducing packaging waste |
| 23 | Female | Once a month | Clothing and Fashion | Yes | Few times a month | Keyword | Multiple pages | 1 | Yes | Often | High shipping costs | Rarely | No | Heavily | Yes | 2 | Sometimes | 3 | 2 | Wide product selection | Reducing packaging waste | Reducing packaging waste |
| 24 | Prefer not to say | Few times a month | Groceries and Gourmet Food;Clothing and Fashion | No | Few times a month | Keyword | Multiple pages | 2 | Yes | Sometimes | Found a better price elsewhere | Rarely | No | Occasionally | No | 4 | No | 3 | 3 | Competitive prices | Product quality and accuracy | Product quality and accuracy |
| 24 | Female | Once a month | Beauty and Personal Care;Clothing and Fashion;others | Sometimes | Few times a month | Keyword | First page | 5 | Maybe | Sometimes | Found a better price elsewhere | Sometimes | Yes | Heavily | Yes | 3 | Sometimes | 3 | 4 | Competitive prices | Product quality and accuracy | Product quality and accuracy |
| 22 | Female | Less than once a month | Beauty and Personal Care;Clothing and Fashion | Yes | Few times a month | Filter | Multiple pages | 1 | Yes | Sometimes | High shipping costs | Rarely | No | Heavily | Yes | 4 | Yes | 2 | 2 | Competitive prices | Product quality and accuracy | Product quality and accuracy |
| 21 | Female | Less than once a month | Clothing and Fashion | No | Rarely | categories | Multiple pages | 1 | Yes | Rarely | Changed my mind or no longer need the item | Never | No | Heavily | Yes | 5 | No | 5 | 2 | Wide product selection | Product quality and accuracy | Product quality and accuracy |
Consumer Behaviour Analysis
INFO 523 - Fall 2023 - Project Final
Pattern Pioneers - Vishal, Joel, Pranshu, Shashwat, Bharath
Our Dataset
Amazon Consumer Behaviour Dataset that we came across in Kaggle was to unveil some customer insights.
It has a comprehensive collection of customer interactions, browsing patterns within the Amazon ecosystem.
It includes a wide range of variables such as customer demographics, user interaction, and reviews.
The dataset aims to provide insights into customer preferences, shopping habits, and decision-making processes on the Amazon platform
Our Dataset
| Variable | Description |
|---|---|
| Purchase_Frequency | How frequently does the user make purchases on Amazon? |
| Product_Search_Method | How does the user search for products on Amazon? |
| Customer_Reviews_Importance | How important are customer reviews in users decision-making process? |
| age | age |
| Gender | gender |
| Browsing_Frequency | How often does the user browse Amazon’s website or app? |
| Purchase_Categories | What product categories does the user typically purchase on Amazon? |
| Cart_Completion_Frequency | How often do user complete the purchase after adding products to their cart? |
| Personalized_Recommendation_Frequency | How often do user receive personalized product recommendations from Amazon? |
| Search_Result_Exploration | Does the user tend to explore multiple pages of search results or focus on the first page? |
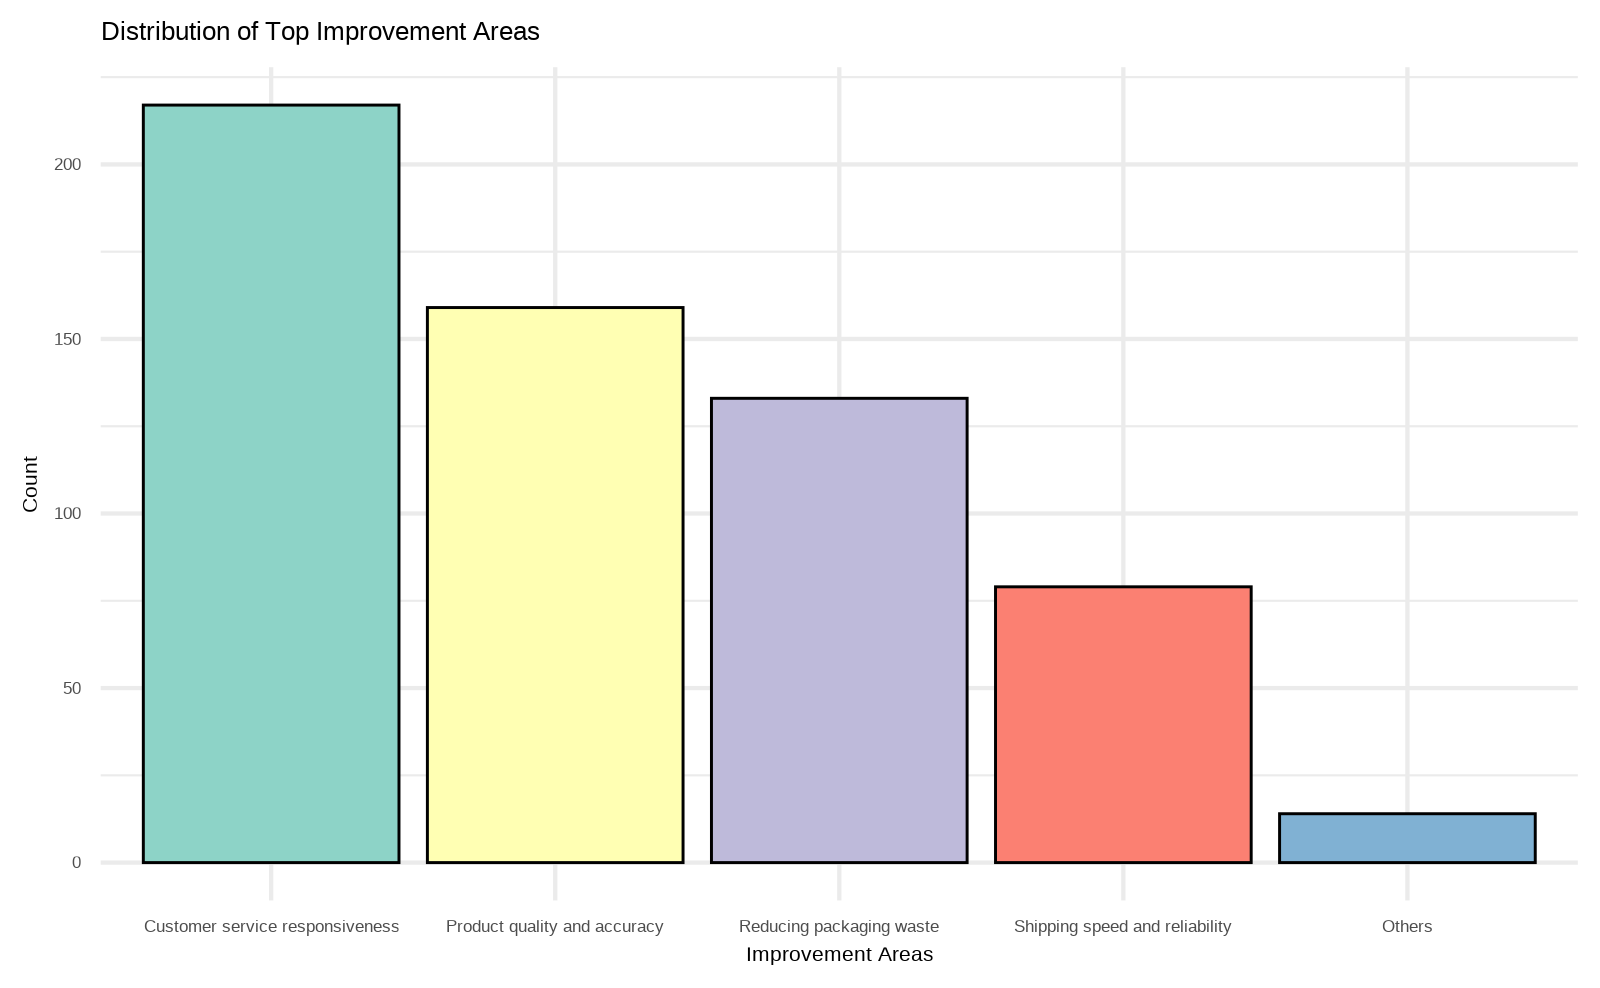
EDA Results- Top Improvement Areas
Question 1
What are the factors influencing the customer’s decision to abandon a purchase in their cart on Amazon?
Approach For Question 1
Data Cleaning:- Our analysis begins with precise exploratory data analysis (EDA) in R, focusing on key variables like Purchase_Frequency, Product_Search_Method, and Customer_Reviews_Importance to understand their impact on cart abandonment. During data cleaning, we ensure proper formatting and address missing values in columns age, Gender, and Browsing_Frequency.
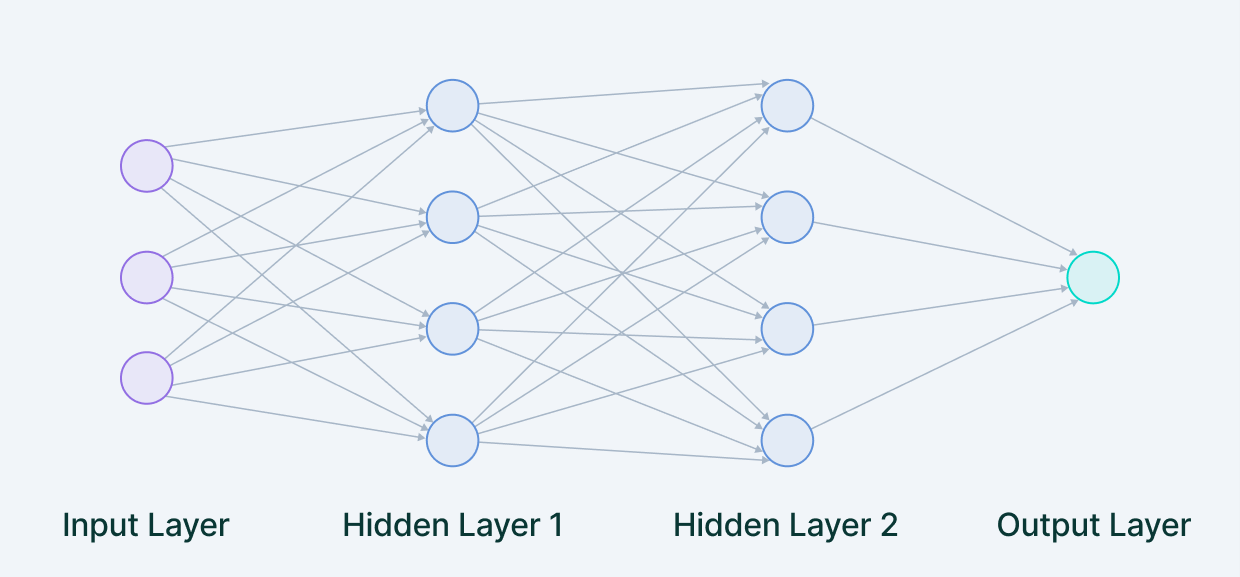
We then apply statistical techniques like neural networks and decision trees to assess the influence of factors such as Personalized_Recommendation_Frequency and Search_Result_Exploration on cart abandonment.
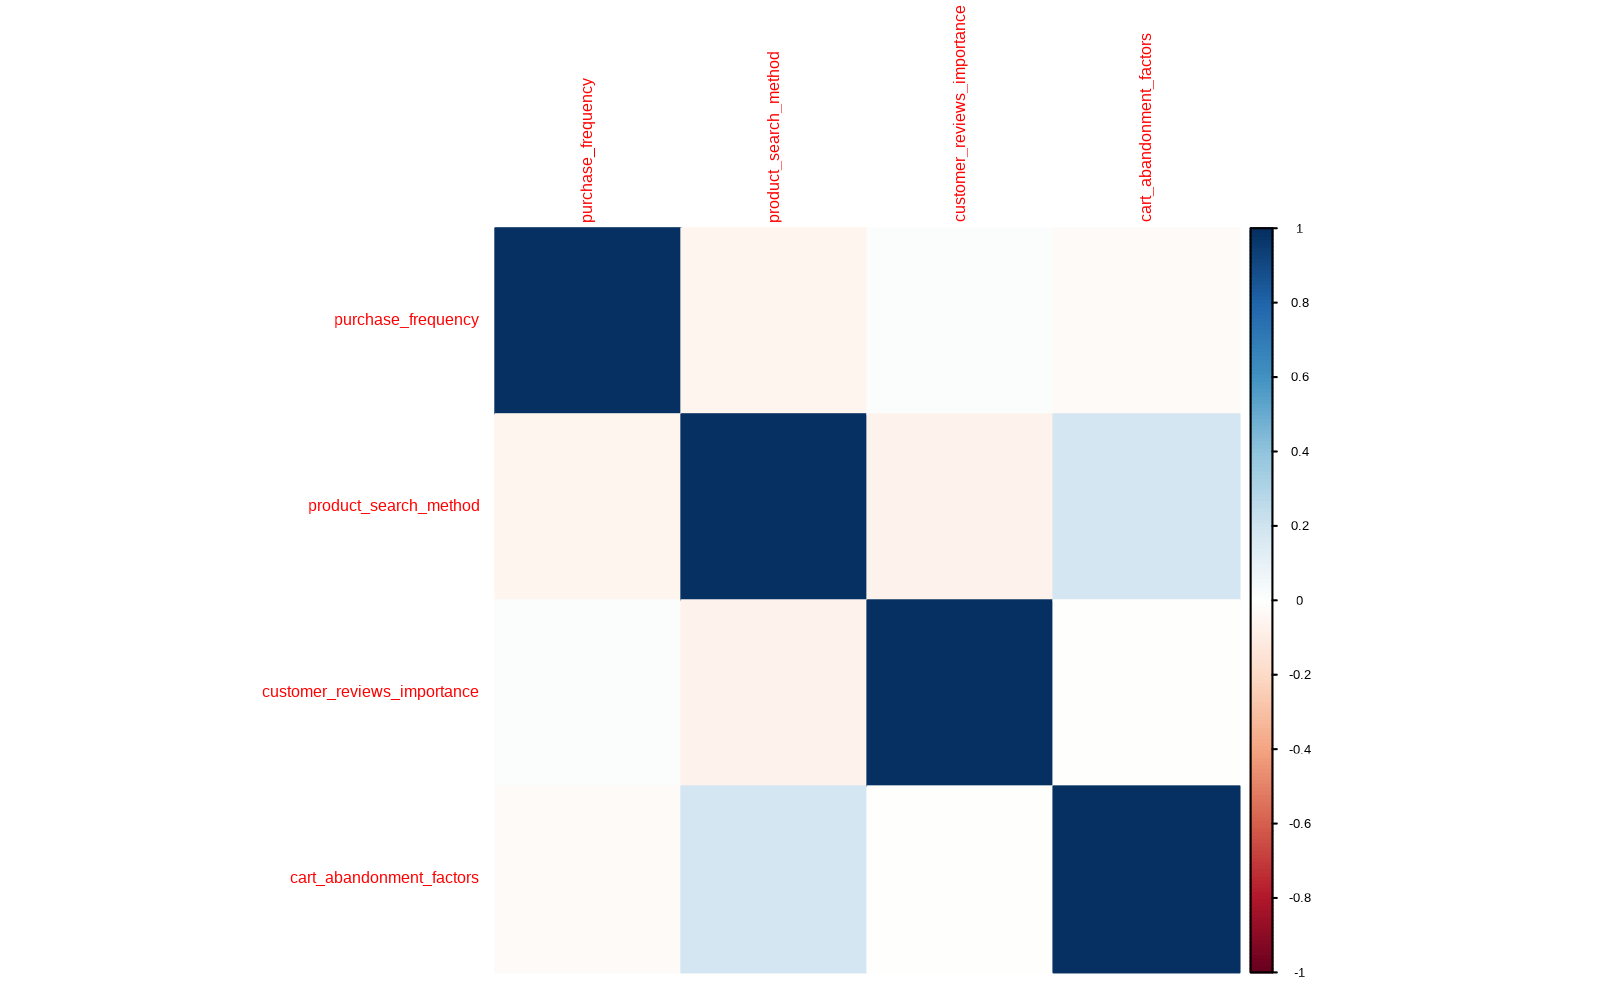
Visualization- For visualisation we utilize the ggplot2 package for creating comprehensive graphics, including correlation maps.
Pre Processing
- Upon examining the data, we observed that a single purchase, represented by a row, was associated with multiple purchase categories.
Pre Processing
- To address this issue and ensure data consistency, we chose to split the categories into separate rows.
| age | gender | purchase_frequency | purchase_category | personalized_recommendation_frequency_6 | browsing_frequency | product_search_method | search_result_exploration | customer_reviews_importance | add_to_cart_browsing | cart_completion_frequency | cart_abandonment_factors | saveforlater_frequency | review_left | review_reliability | review_helpfulness | personalized_recommendation_frequency_18 | recommendation_helpfulness | rating_accuracy | shopping_satisfaction | service_appreciation | improvement_areas | grouped_improvement_areas |
|---|---|---|---|---|---|---|---|---|---|---|---|---|---|---|---|---|---|---|---|---|---|---|
| 23 | Female | Few times a month | Beauty and Personal Care | Yes | Few times a week | Keyword | Multiple pages | 1 | Yes | Sometimes | Found a better price elsewhere | Sometimes | Yes | Occasionally | Yes | 2 | Yes | 1 | 1 | Competitive prices | Reducing packaging waste | Reducing packaging waste |
| 23 | Female | Once a month | Clothing and Fashion | Yes | Few times a month | Keyword | Multiple pages | 1 | Yes | Often | High shipping costs | Rarely | No | Heavily | Yes | 2 | Sometimes | 3 | 2 | Wide product selection | Reducing packaging waste | Reducing packaging waste |
| 24 | Prefer not to say | Few times a month | Groceries and Gourmet Food | No | Few times a month | Keyword | Multiple pages | 2 | Yes | Sometimes | Found a better price elsewhere | Rarely | No | Occasionally | No | 4 | No | 3 | 3 | Competitive prices | Product quality and accuracy | Product quality and accuracy |
| 24 | Prefer not to say | Few times a month | Clothing and Fashion | No | Few times a month | Keyword | Multiple pages | 2 | Yes | Sometimes | Found a better price elsewhere | Rarely | No | Occasionally | No | 4 | No | 3 | 3 | Competitive prices | Product quality and accuracy | Product quality and accuracy |
| 24 | Female | Once a month | Beauty and Personal Care | Sometimes | Few times a month | Keyword | First page | 5 | Maybe | Sometimes | Found a better price elsewhere | Sometimes | Yes | Heavily | Yes | 3 | Sometimes | 3 | 4 | Competitive prices | Product quality and accuracy | Product quality and accuracy |
| 24 | Female | Once a month | Clothing and Fashion | Sometimes | Few times a month | Keyword | First page | 5 | Maybe | Sometimes | Found a better price elsewhere | Sometimes | Yes | Heavily | Yes | 3 | Sometimes | 3 | 4 | Competitive prices | Product quality and accuracy | Product quality and accuracy |
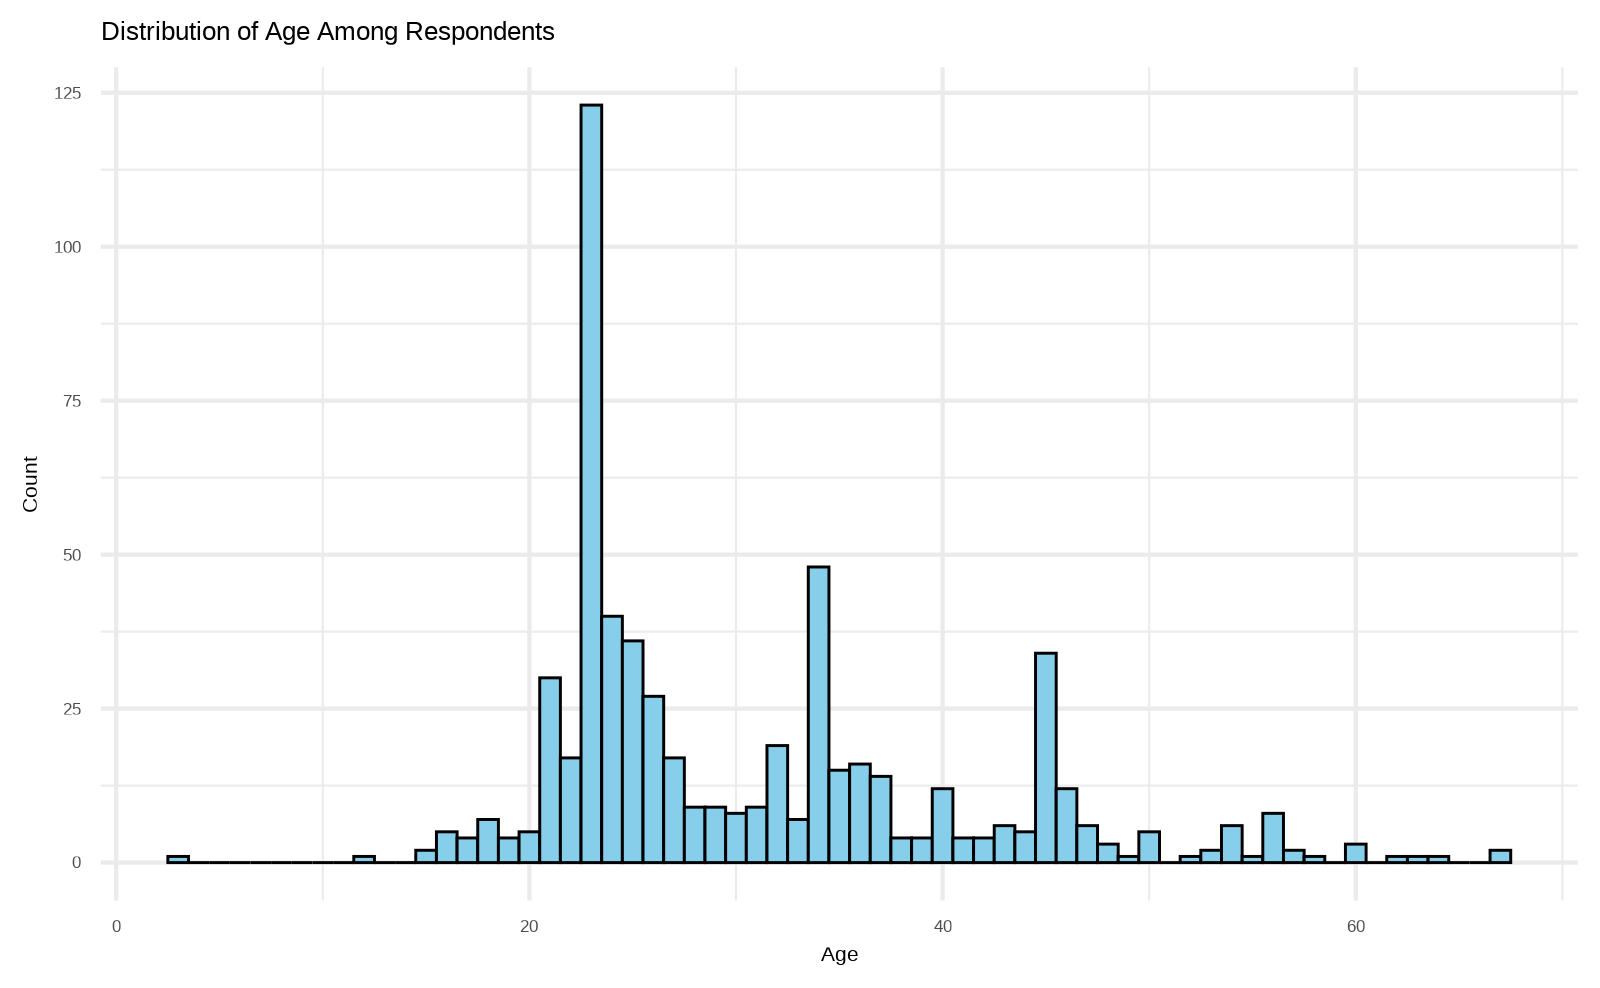
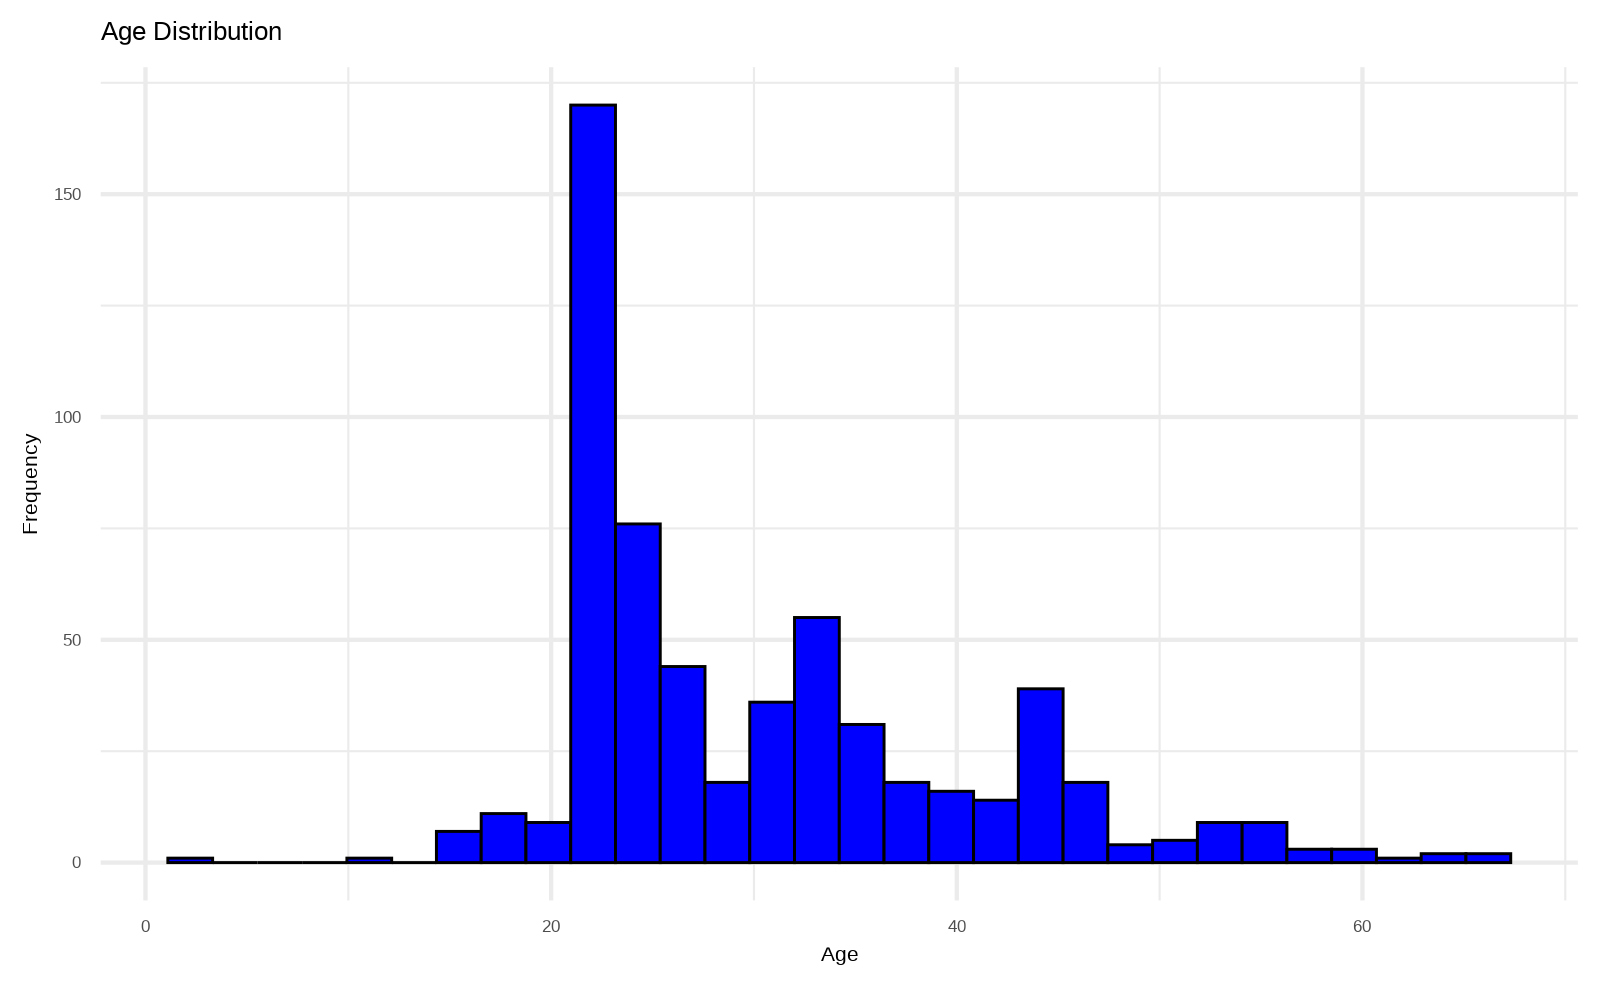
EDA Results - Age Distribution
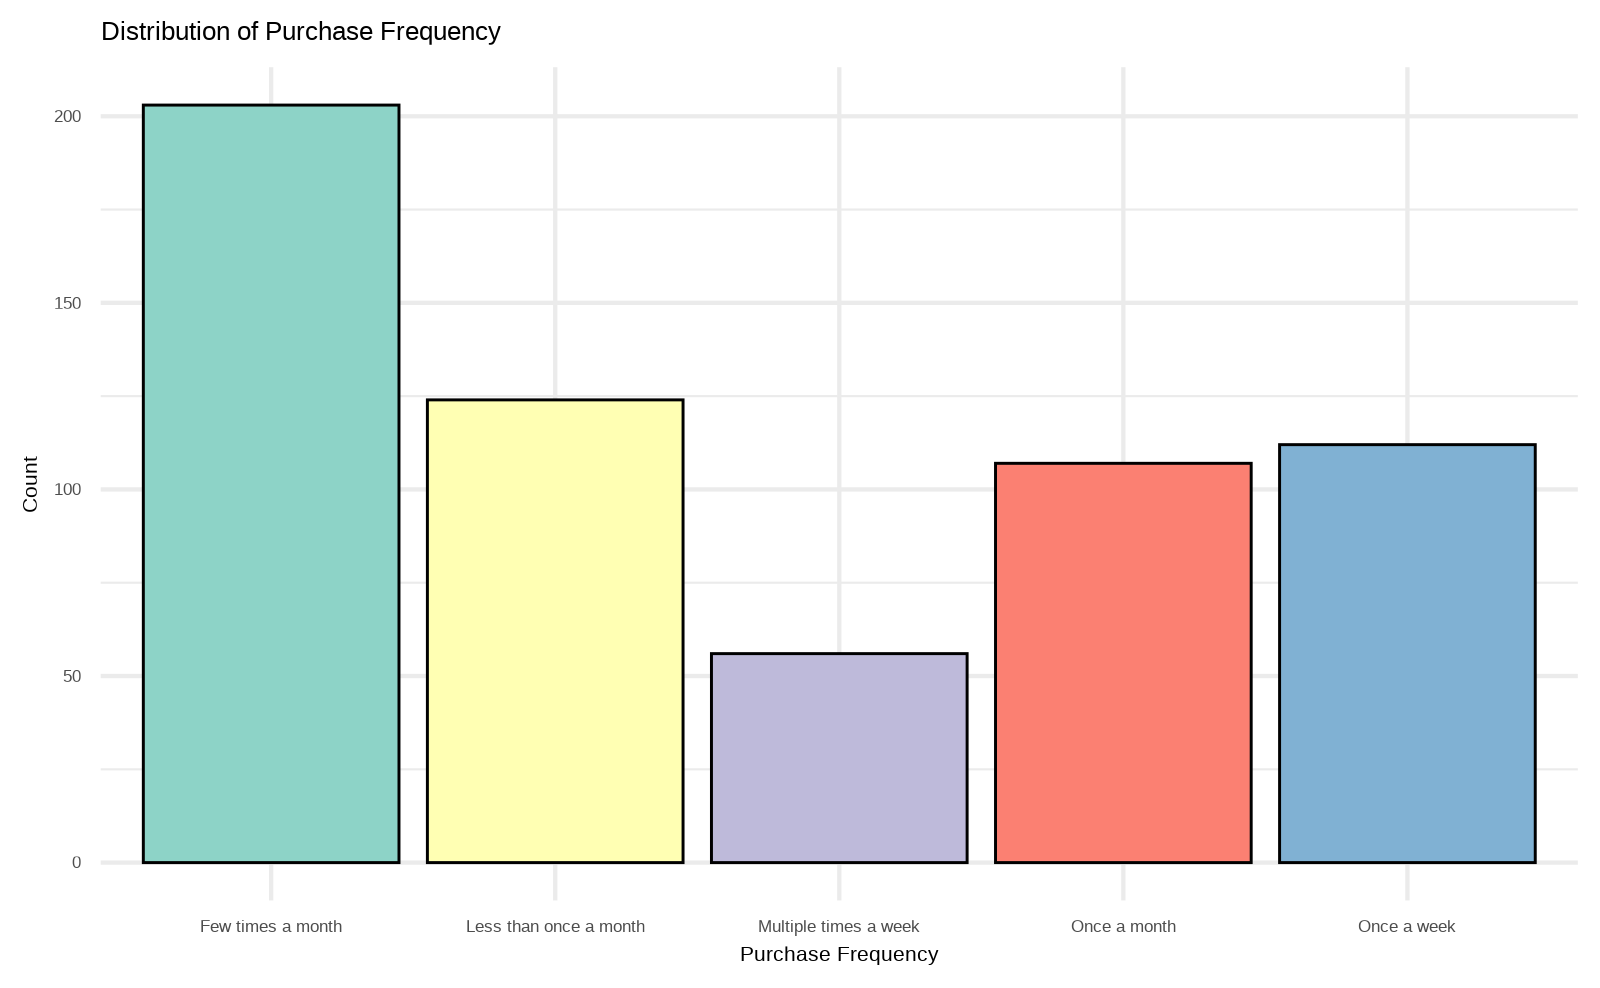
EDA Results - Purchase Frequency
Models Used
- Neural Networks
- Decision Tree
Correlation Matrix for Consumer Behaviour
Modeling - NNET
Modeling - Decision Tree
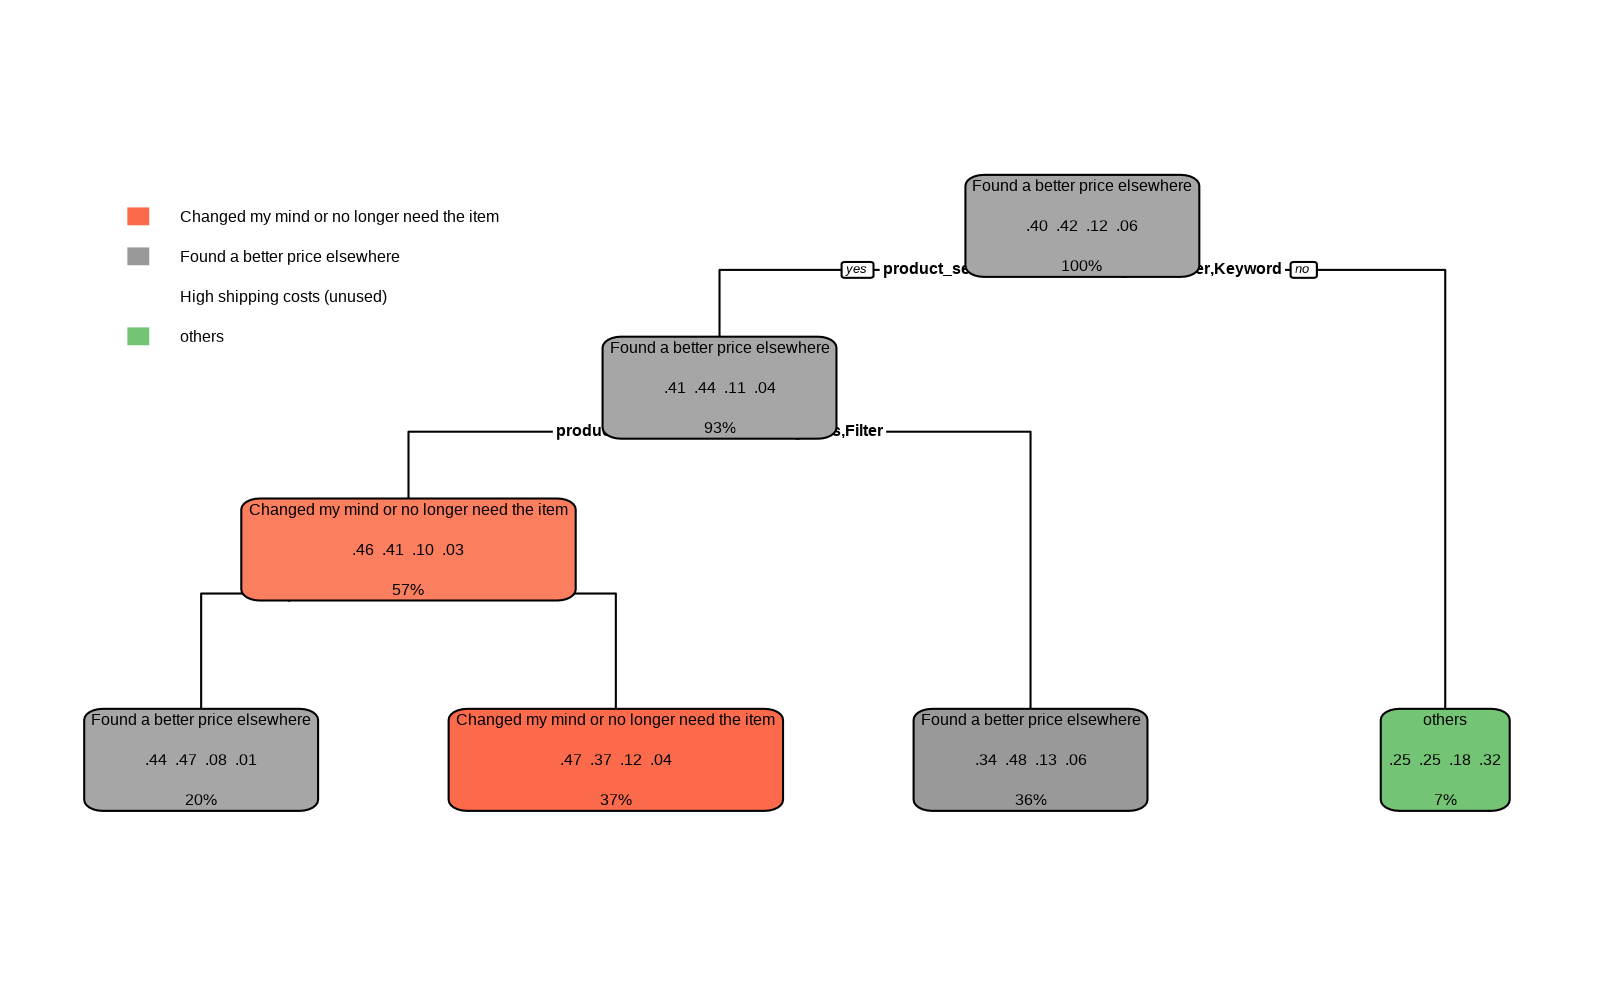
- Key Takeaway- The most important factor for people abandoning there carts was that “they found a better price elsewhere”
Question 2
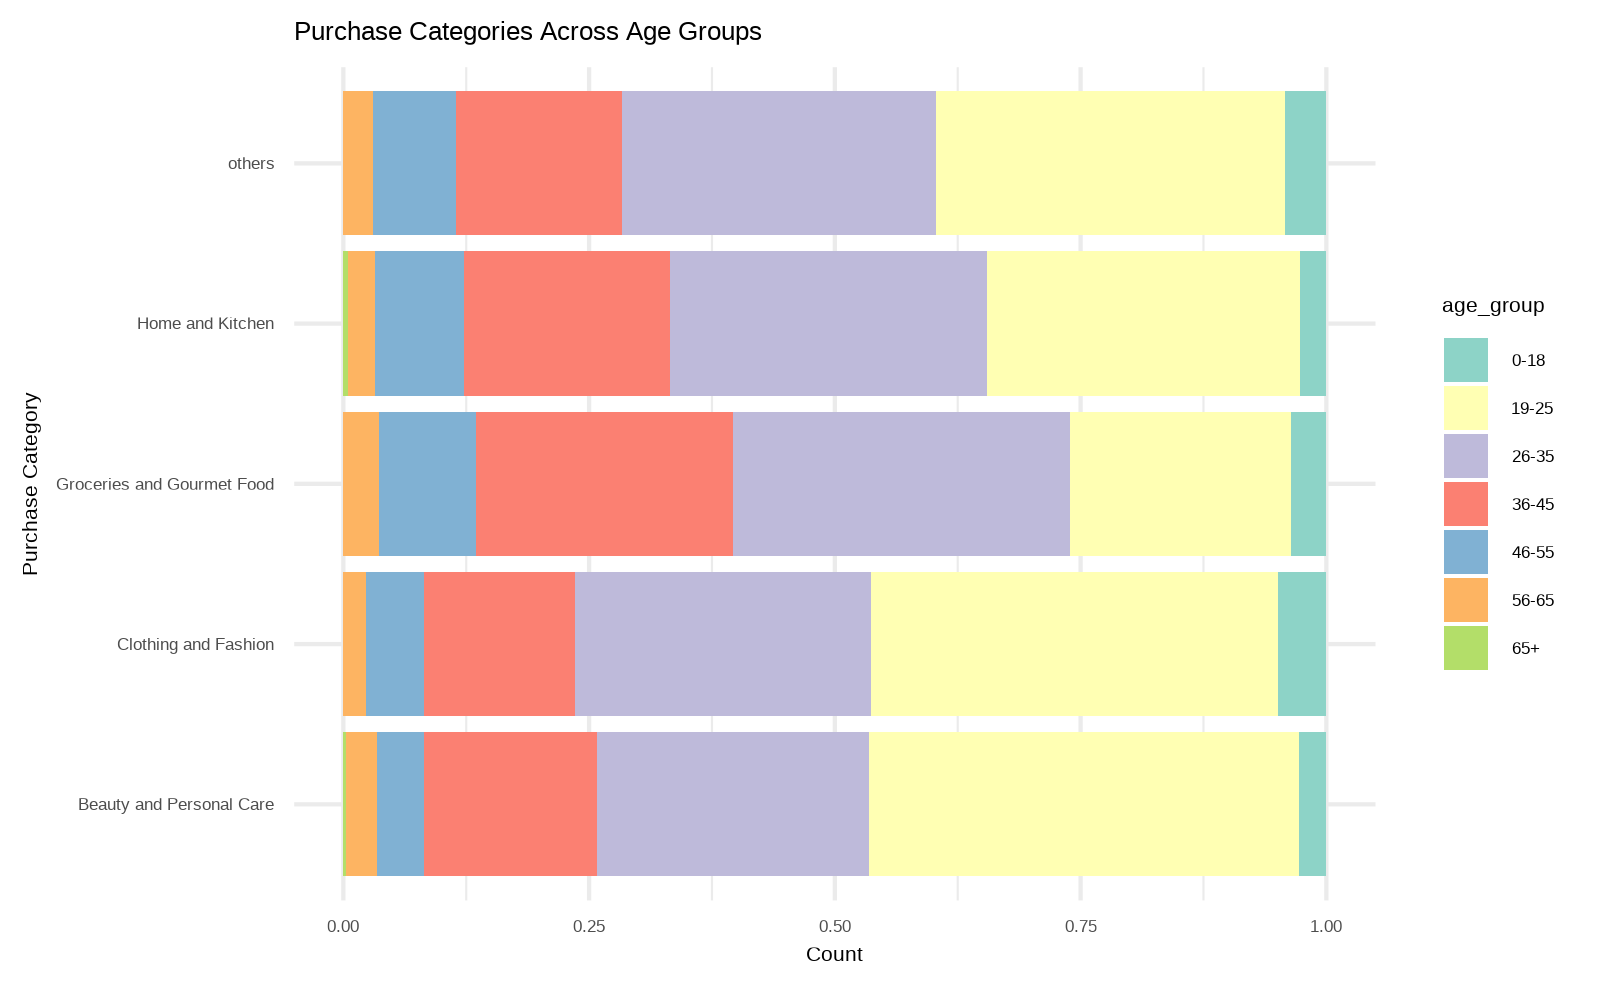
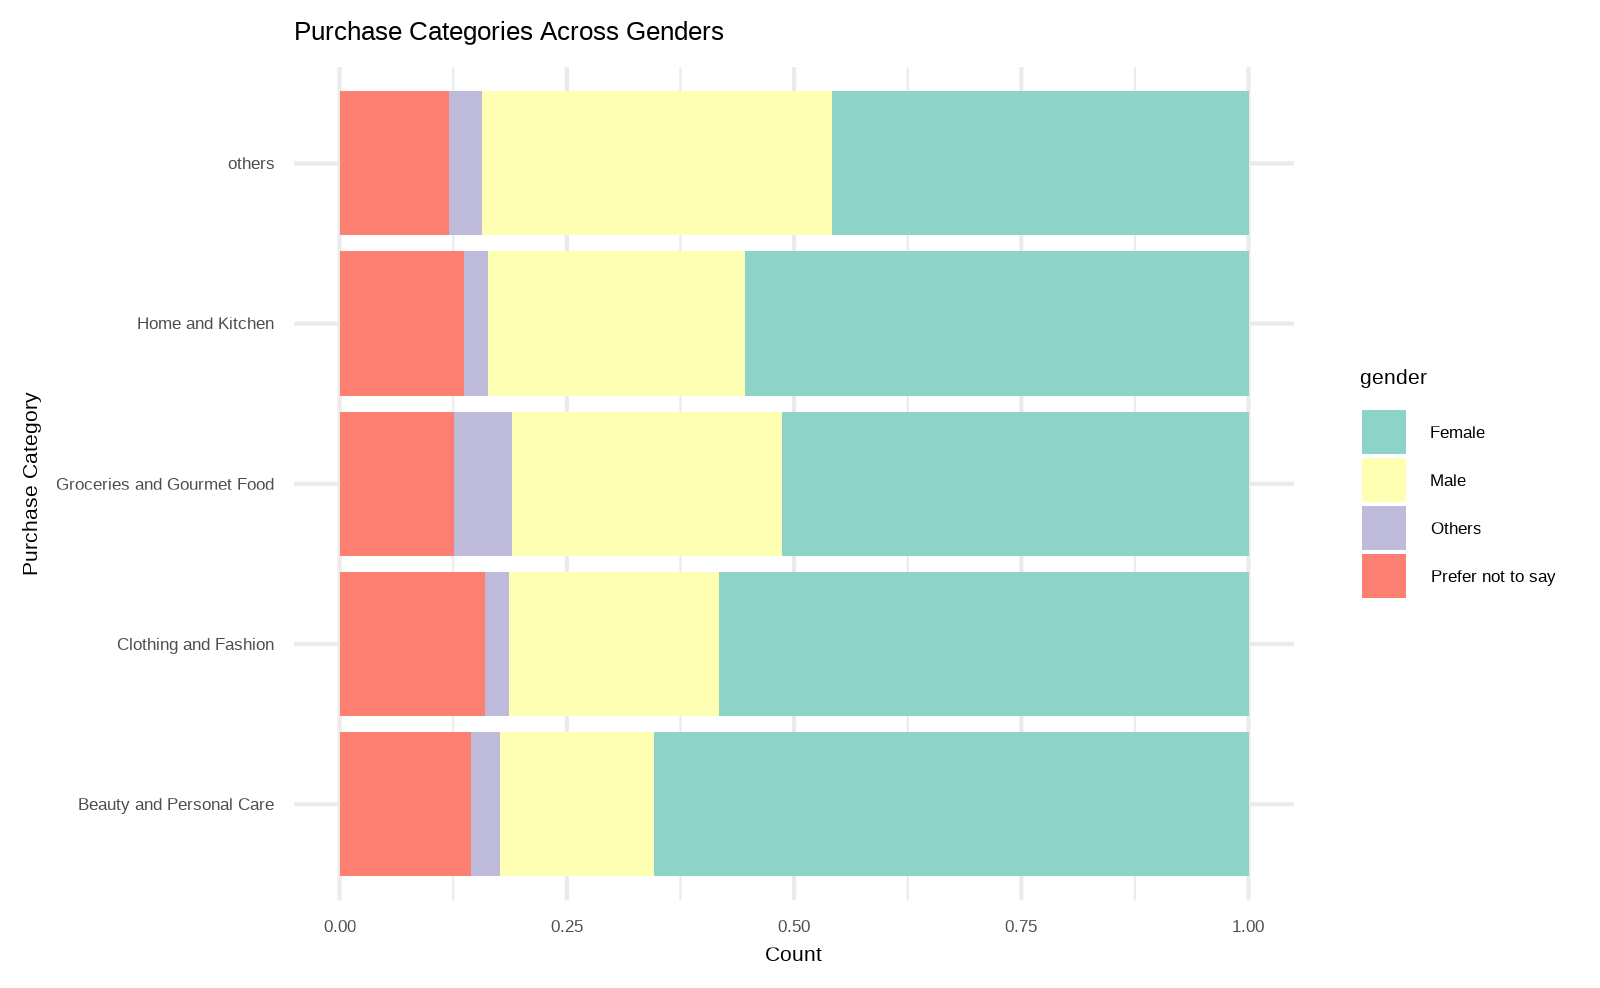
Which demographic (on the basis of gender and age) is most likely to purchase a particular product category?
Approach For Question 2
The approach that we took to solve determine which demographic is most likely to purchase a particular product category is as follows:
Data Cleaning: We checked the data set for any inconsistencies like missing values or incorrect data. Then we tried to handle the outliers if they needed to be removed.
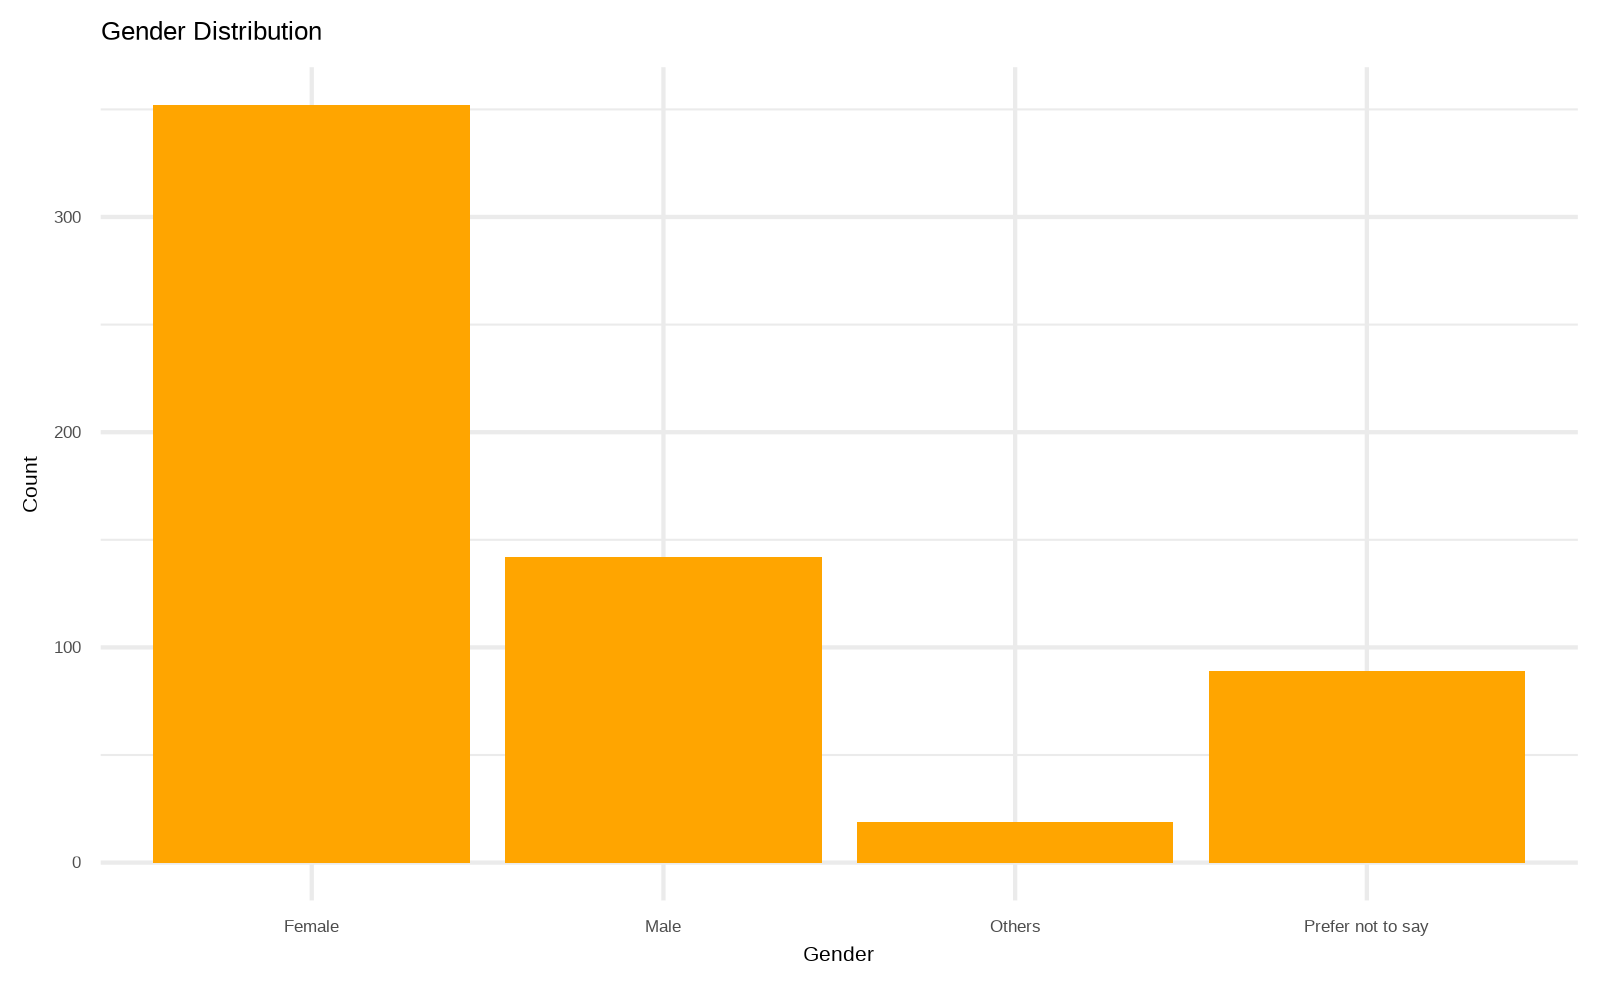
Summary statistics: After data cleaning we performed the summary statistics for important columns like purchase category, age group, gender which helped us understand the characteristics and the distribution of data.
Visualization: After a few steps of data transformation which included splitting the rows having multiple purchase categories into multiple rows with same data in other columns we performed some visualizations using ggplot to represent the data with the bar plots which helped us to figure out some trends and patterns of our data.
Modelling: In the final part we performed statistical modelling to assess the likelihood of purchasing different product categories based on demographic variables like age and gender. We achieved this goal by using logistic regression models to predict the probability of a particular demographic to purchase each category.
EDA Results
EDA Results
EDA Results
EDA Results
Modeling
Model for Question 2
for (category in unique_categories) {
  # Binary variable for each category
  df_expanded[[category]] <- ifelse(df_expanded$purchase_category == category, 1, 0)

  # Model
  model_formula <- as.formula(paste(category, "~ age_group + gender"))
  model <- multinom(model_formula, data=df_expanded)

  # Store the model
  models[[category]] <- model

  # Evaluation
  predictions <- predict(model, df_expanded)
  reports[[category]] <- confusionMatrix(data=factor(predictions, levels=c(0,1)),
                                         reference=factor(df_expanded[[category]], levels=c(0,1)))
}
Challenges faced
- Insufficient amount of data to conduct a full fledged analysis on cart abandonment factors.
- The dataset contained time value for only a couple of weeks.
- Finalizing the model which correctly analyzes the data.
- Class Imbalance issue while modeling using logistic regression.
- Some models we tried are over fitting the data like random forest.
Outcome
- Exploring the pros and cons of neural networks in our dataset.
- Handling datasets and experimenting with models that can be applied for real-time use cases.
- We identified the key factors which decides on the car abandonment.