Descriptive Analysis of Grade Outcomes
INFO 523 - Fall 2023 - Project Final
Introduction
- Goal: To analyze and understand the student grade outcomes at the University of Arizona (UArizona) before, during, and after the COVID-19 pandemic.
Research Questions:
Pattern Analysis – What if any patterns or relationships exist between colleges, departments, or course level and grade outcomes for enrolled students?
Predictive Modeling – Can a predictive model be developed that accurately forecasts grade outcomes based on course attributes?
Datasets
DEW Rates – Breakdown of grade value outcomes during the academic years of 2018-19, 2019-20, and 2020-21 at UArizona It consists of 35697 observations of courses with 23 variables related to enrollment and grade values .
Course Attributes – Course attributes for the academic years of 2019-20, and 2020-21 at UArizona. There are over 260,000 observations of courses with 27 variables per observation.
EDA
For both data sets, we started with checking all columns and data shape. We decided which columns we will be using. We also checked and handled missing values.
Check columns of the “DEW Rates” data set
| X | College | Department | Subject.Code | Catalog.Number | Course.Description | Course.Level | Total.Student.Count | D_GRADE_COUNT | FAIL_GRADE_COUNT | WITHDRAW_GRADE_COUNT | DEW_COUNT | PASS_GRADE_COUNT | WITHDRAW_FULLMED_GRADE_COUNT | INCOMPLETE_UNGRADED_COUNT | TERM_LD | ACAD_YR_SID | Percent.D.Grade | Percent.E.Grade | Percent.W.Grade | Percent.DEW | Percent.Passed | Per.Full..Medical.Withdrawal | Per.Ungraded..Incomplete |
|---|---|---|---|---|---|---|---|---|---|---|---|---|---|---|---|---|---|---|---|---|---|---|---|
| 1 | College of Engineering | Aerospace & Mechanical Engr | ABE | 489A | Fab Tech Micro+Nanodevic | Upper Division | 10 | 0 | 0 | 0 | 0 | 10 | 0 | 0 | Fall 2018 | 2019 | 0.0 | 0.0 | 0.0 | 0.0 | 100.0 | 0.0 | 0 |
| 2 | College of Engineering | Aerospace & Mechanical Engr | AME | 105 | Introduction to MATLAB I | Lower Division | 196 | 17 | 2 | 1 | 20 | 173 | 3 | 0 | Fall 2018 | 2019 | 8.7 | 1.0 | 0.5 | 10.2 | 88.3 | 1.5 | 0 |
| 3 | College of Engineering | Aerospace & Mechanical Engr | AME | 105 | Introduction to MATLAB I | Lower Division | 160 | 22 | 17 | 3 | 42 | 115 | 3 | 0 | Fall 2019 | 2020 | 13.8 | 10.6 | 1.9 | 26.3 | 71.9 | 1.9 | 0 |
| 4 | College of Engineering | Aerospace & Mechanical Engr | AME | 105 | Introduction to MATLAB I | Lower Division | 111 | 11 | 4 | 5 | 20 | 82 | 9 | 0 | Fall 2020 | 2021 | 9.9 | 3.6 | 4.5 | 18.0 | 73.9 | 8.1 | 0 |
| 5 | College of Engineering | Aerospace & Mechanical Engr | AME | 105 | Introduction to MATLAB I | Lower Division | 254 | 11 | 5 | 6 | 22 | 231 | 1 | 0 | Spring 2019 | 2019 | 4.3 | 2.0 | 2.4 | 8.7 | 90.9 | 0.4 | 0 |
| 6 | College of Engineering | Aerospace & Mechanical Engr | AME | 105 | Introduction to MATLAB I | Lower Division | 213 | 3 | 9 | 19 | 31 | 182 | 0 | 0 | Spring 2020 | 2020 | 1.4 | 4.2 | 8.9 | 14.6 | 85.4 | 0.0 | 0 |
Check columns of the “Course Attributes” data set
| X | Course.Identifier | College | Department | Merged | Subject.Code | Catalog.Number | Course.Description | Course.Level | Total.Student.Count | D_GRADE_COUNT | FAIL_GRADE_COUNT | WITHDRAW_GRADE_COUNT | DEW_COUNT | PASS_GRADE_COUNT | WITHDRAW_FULLMED_GRADE_COUNT | INCOMPLETE_UNGRADED_COUNT | TERM_LD | ACAD_YR_SID | Percent.D.Grade | Percent.E.Grade | Percent.W.Grade | Percent.DEW | Percent.Passed | Per.Full..Medical.Withdrawal | Per.Ungraded..Incomplete | P.F.Opt | Units | Mode | Class.. | Sections | Total.Enroll | Max.Enroll | Rm.Cap | Early_Morning | Mid_Morning | Early_Afternoon | Mid_Afternoon | Evening | Asynchronous | Monday | Tuesday | Wednesday | Thursday | Friday | Saturday | Sunday | Laboratory | Lecture | Colloquim | Seminar | Workshop | Discussion | Studio | Practicum | In_Person | Full_Online | IntractTV | Hybrid | Live_Online | Reg_Session | First_Half_Session | Second_Half_Session | First_Third_Session | Second_Third_Session | Third_Third_Session | Ten_Week | Thirteen_Week | Other | College_Number |
|---|---|---|---|---|---|---|---|---|---|---|---|---|---|---|---|---|---|---|---|---|---|---|---|---|---|---|---|---|---|---|---|---|---|---|---|---|---|---|---|---|---|---|---|---|---|---|---|---|---|---|---|---|---|---|---|---|---|---|---|---|---|---|---|---|---|---|---|---|---|
| 1 | Fall 2019_ACBS_102L | College of Agric and Life Sci | Animal&Biomedical Sciences-Ins | ACBS_102L | ACBS | 102L | Intro to Animal Sci Lab | Lower Division | 250 | 8 | 7 | 3 | 18 | 229 | 3 | 0 | Fall 2019 | 2020 | 3.2 | 2.8 | 1.2 | 7.2 | 91.6 | 1.2 | 0 | 1 | In Person | 450809 | 8 | 250 | 280 | 8 | 0 | 0 | 8 | 0 | 0 | 0 | 0 | 4 | 0 | 4 | 0 | 0 | 0 | 8 | 0 | 0 | 0 | 0 | 0 | 0 | 0 | 8 | 0 | 0 | 0 | 0 | 8 | 0 | 0 | 0 | 0 | 0 | 0 | 0 | 0 | 1 | |
| 2 | Fall 2019_ACBS_102R | College of Agric and Life Sci | Animal&Biomedical Sciences-Ins | ACBS_102R | ACBS | 102R | Introd to Animal Science | Lower Division | 267 | 7 | 10 | 2 | 19 | 244 | 4 | 0 | Fall 2019 | 2020 | 2.6 | 3.7 | 0.7 | 7.1 | 91.4 | 1.5 | 0 | 3 | In Person | 41166 | 1 | 267 | 299 | 300 | 1 | 0 | 0 | 0 | 0 | 0 | 0 | 1 | 0 | 1 | 0 | 0 | 0 | 0 | 1 | 0 | 0 | 0 | 0 | 0 | 0 | 1 | 0 | 0 | 0 | 0 | 1 | 0 | 0 | 0 | 0 | 0 | 0 | 0 | 0 | 1 | |
| 3 | Fall 2019_ACBS_142 | College of Agric and Life Sci | Animal&Biomedical Sciences-Ins | ACBS_142 | ACBS | 142 | Intro Anml Racing Indus | Lower Division | 28 | 0 | 2 | 0 | 2 | 26 | 0 | 0 | Fall 2019 | 2020 | 0.0 | 7.1 | 0.0 | 7.1 | 92.9 | 0.0 | 0 | 2 | In Person | 25697 | 1 | 28 | 20 | 80 | 1 | 0 | 0 | 0 | 0 | 0 | 1 | 0 | 1 | 0 | 0 | 0 | 0 | 0 | 1 | 0 | 0 | 0 | 0 | 0 | 0 | 1 | 0 | 0 | 0 | 0 | 1 | 0 | 0 | 0 | 0 | 0 | 0 | 0 | 0 | 1 | |
| 4 | Fall 2019_ACBS_160D1 | College of Agric and Life Sci | Animal&Biomedical Sciences-Ins | ACBS_160D1 | ACBS | 160D1 | Hum+Anml Interl Dom-Pres | Lower Division | 681 | 30 | 72 | 8 | 110 | 561 | 10 | 0 | Fall 2019 | 2020 | 4.4 | 10.6 | 1.2 | 16.2 | 82.4 | 1.5 | 0 | 3 | In Person | 95423 | 2 | 481 | 707 | 912 | 1 | 1 | 0 | 0 | 0 | 0 | 2 | 0 | 2 | 0 | 2 | 0 | 0 | 0 | 2 | 0 | 0 | 0 | 0 | 0 | 0 | 2 | 0 | 0 | 0 | 0 | 2 | 0 | 0 | 0 | 0 | 0 | 0 | 0 | 0 | 1 | |
| 5 | Fall 2019_ACBS_160D1 | College of Agric and Life Sci | Animal&Biomedical Sciences-Ins | ACBS_160D1 | ACBS | 160D1 | Hum+Anml Interl Dom-Pres | Lower Division | 681 | 30 | 72 | 8 | 110 | 561 | 10 | 0 | Fall 2019 | 2020 | 4.4 | 10.6 | 1.2 | 16.2 | 82.4 | 1.5 | 0 | 3 | FullOnline | 67075 | 1 | 200 | 200 | 1 | 0 | 0 | 0 | 0 | 0 | 1 | 0 | 0 | 0 | 0 | 0 | 0 | 0 | 0 | 1 | 0 | 0 | 0 | 0 | 0 | 0 | 0 | 1 | 0 | 0 | 0 | 1 | 0 | 0 | 0 | 0 | 0 | 0 | 0 | 0 | 1 | |
| 6 | Fall 2019_ACBS_195F | College of Agric and Life Sci | Animal&Biomedical Sciences-Ins | ACBS_195F | ACBS | 195F | Careers/Veterinary Sci | Lower Division | 205 | 11 | 17 | 1 | 29 | 173 | 3 | 0 | Fall 2019 | 2020 | 5.4 | 8.3 | 0.5 | 14.1 | 84.4 | 1.5 | 0 | 1 | In Person | 38050 | 1 | 205 | 190 | 300 | 0 | 1 | 0 | 0 | 0 | 0 | 0 | 0 | 1 | 0 | 0 | 0 | 0 | 0 | 0 | 0 | 0 | 0 | 0 | 0 | 0 | 1 | 0 | 0 | 0 | 0 | 1 | 0 | 0 | 0 | 0 | 0 | 0 | 0 | 0 | 1 |
Total course offering for each college per semester
| College | Fall 2018 | Fall 2019 | Fall 2020 | Spring 2019 | Spring 2020 | Spring 2021 |
|---|---|---|---|---|---|---|
| College of Agric and Life Sci | 219 | 224 | 247 | 230 | 236 | 225 |
| College of Applied Sci & Tech | 124 | 117 | 112 | 123 | 119 | 107 |
| College of Education | 89 | 96 | 96 | 92 | 97 | 105 |
| College of Engineering | 149 | 157 | 143 | 165 | 171 | 169 |
| College of Fine Arts | 260 | 259 | 230 | 265 | 259 | 239 |
| College of Humanities | 242 | 245 | 257 | 244 | 272 | 276 |
| College of Medicine - Tucson | 22 | 27 | 28 | 29 | 35 | 36 |
| College of Nursing | 12 | 16 | 20 | 11 | 21 | 21 |
| College of Public Health | 27 | 31 | 30 | 27 | 31 | 34 |
| College of Science | 274 | 269 | 279 | 290 | 290 | 299 |
| College of Social & Behav Sci | 540 | 531 | 537 | 553 | 585 | 566 |
| Colleges of Letters Arts & Sci | 7 | 7 | NA | 5 | 4 | NA |
| Eller College of Management | 125 | 128 | 121 | 137 | 141 | 125 |
| Graduate College | 12 | 13 | 16 | 14 | 14 | 13 |
| James E Rogers College of Law | 20 | 20 | 25 | 21 | 24 | 29 |
| R Ken Coit College of Pharmacy | 5 | 6 | 7 | 5 | 8 | 8 |
| W.A. Franke Honors College | 15 | 11 | 10 | 21 | 17 | 18 |
Then, we limited focus to the top 5 colleges by course enrollment.
Then, we looked at the total student enrollment for each college per semester.
| College | Fall 2018 | Fall 2019 | Fall 2020 | Spring 2019 | Spring 2020 | Spring 2021 |
|---|---|---|---|---|---|---|
| College of Agric and Life Sci | 13310 | 14409 | 16574 | 11688 | 13396 | 13945 |
| College of Humanities | 19290 | 19456 | 19706 | 18553 | 18814 | 18276 |
| College of Science | 39301 | 39964 | 39898 | 35013 | 34275 | 34832 |
| College of Social & Behav Sci | 33478 | 31942 | 31961 | 31092 | 31231 | 30813 |
| Eller College of Management | 20425 | 19985 | 19586 | 18923 | 18712 | 18047 |
We also looked at the total D, E, and W grade counts for each college per semester.
| College | Fall 2018 | Fall 2019 | Fall 2020 | Spring 2019 | Spring 2020 | Spring 2021 |
|---|---|---|---|---|---|---|
| College of Agric and Life Sci | 1405 | 1458 | 2041 | 1160 | 1039 | 1625 |
| College of Humanities | 2760 | 2678 | 3081 | 2509 | 2377 | 2934 |
| College of Science | 7879 | 7389 | 7148 | 6705 | 3871 | 6023 |
| College of Social & Behav Sci | 4704 | 4296 | 5043 | 4263 | 3348 | 4615 |
| Eller College of Management | 2501 | 2175 | 2203 | 1906 | 950 | 1730 |
We calculated the mean averages for the pass, D, E, W, and DEW rates across the five selected colleges.
| College | PASS GRADE COUNT | D GRADE COUNT | FAIL GRADE COUNT | WITHDRAW GRADE COUNT | DEW COUNT |
|---|---|---|---|---|---|
| College of Agric and Life Sci | 53.17 | 1.81 | 2.74 | 1.77 | 6.32 |
| College of Humanities | 62.16 | 2.36 | 4.89 | 3.38 | 10.64 |
| College of Science | 105.84 | 7.36 | 8.82 | 6.76 | 22.94 |
| College of Social & Behav Sci | 48.42 | 1.90 | 3.60 | 2.43 | 7.93 |
| Eller College of Management | 132.50 | 5.62 | 4.97 | 4.16 | 14.76 |
Anomaly Detection
In order to identify patterns or trends in the Grade Outcomes, we wanted to better understand the current anomalies in the data. We focused on identifying outliers with a high value of poor grade outcomes.
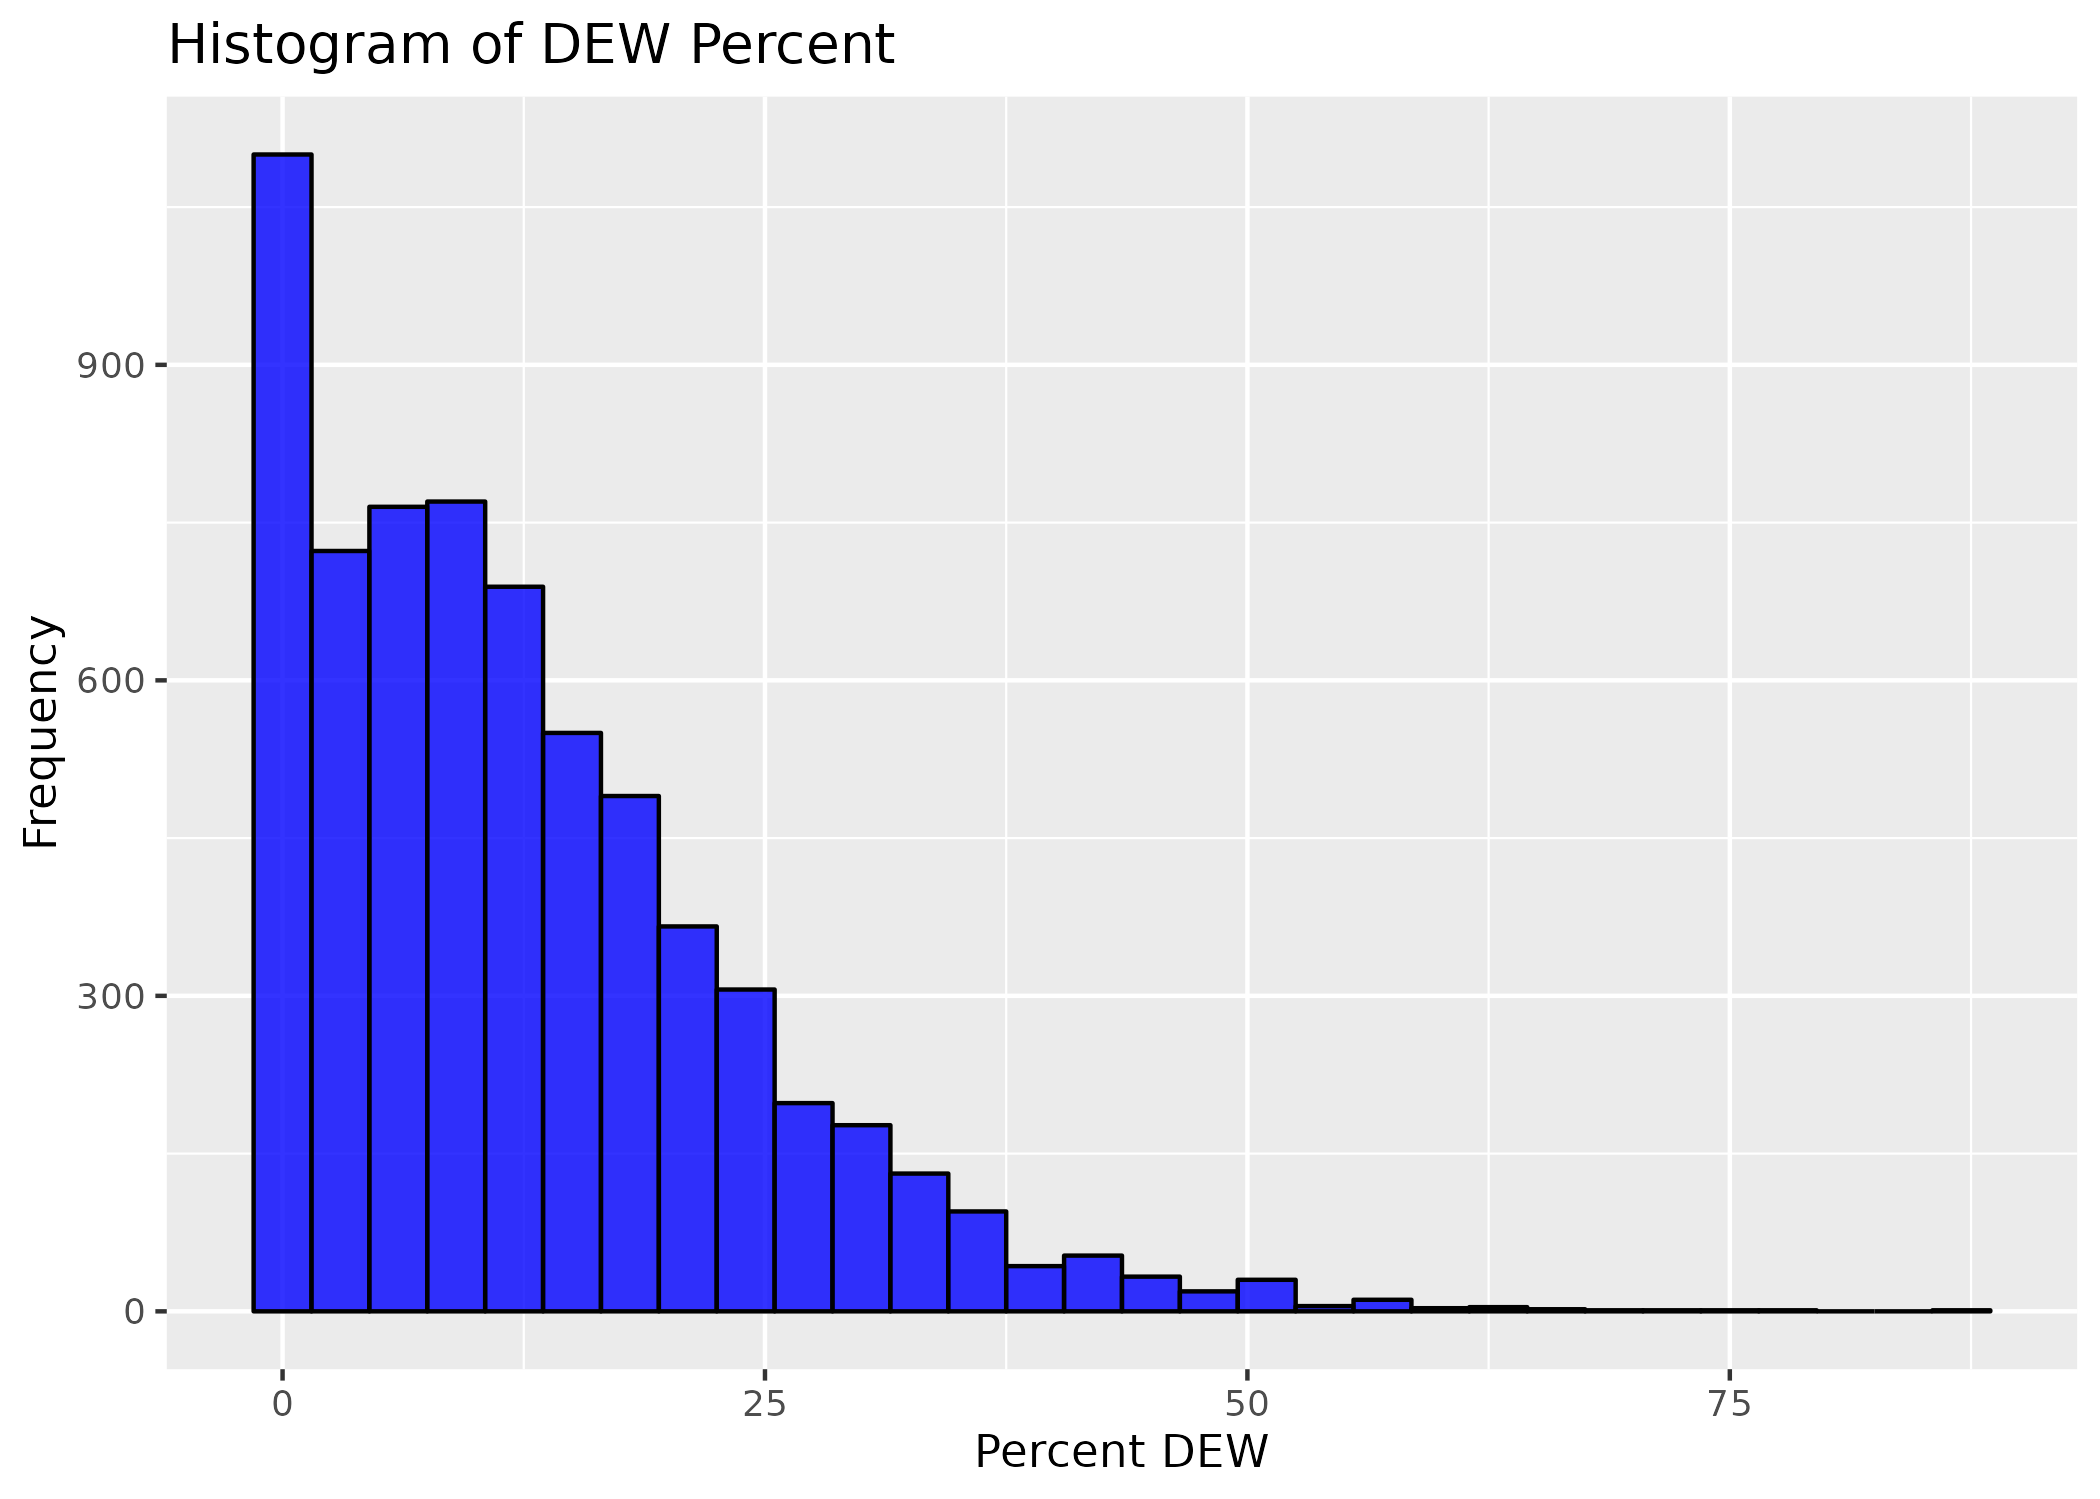
   Min. 1st Qu.  Median    Mean 3rd Qu.    Max.
   0.00    4.00   10.25   12.55   18.20   85.70
Here we verify that mean value is the 12.55% as we found in the initial EDA..
Histogram of DEW Percentages
Box Plot of DEW Percents
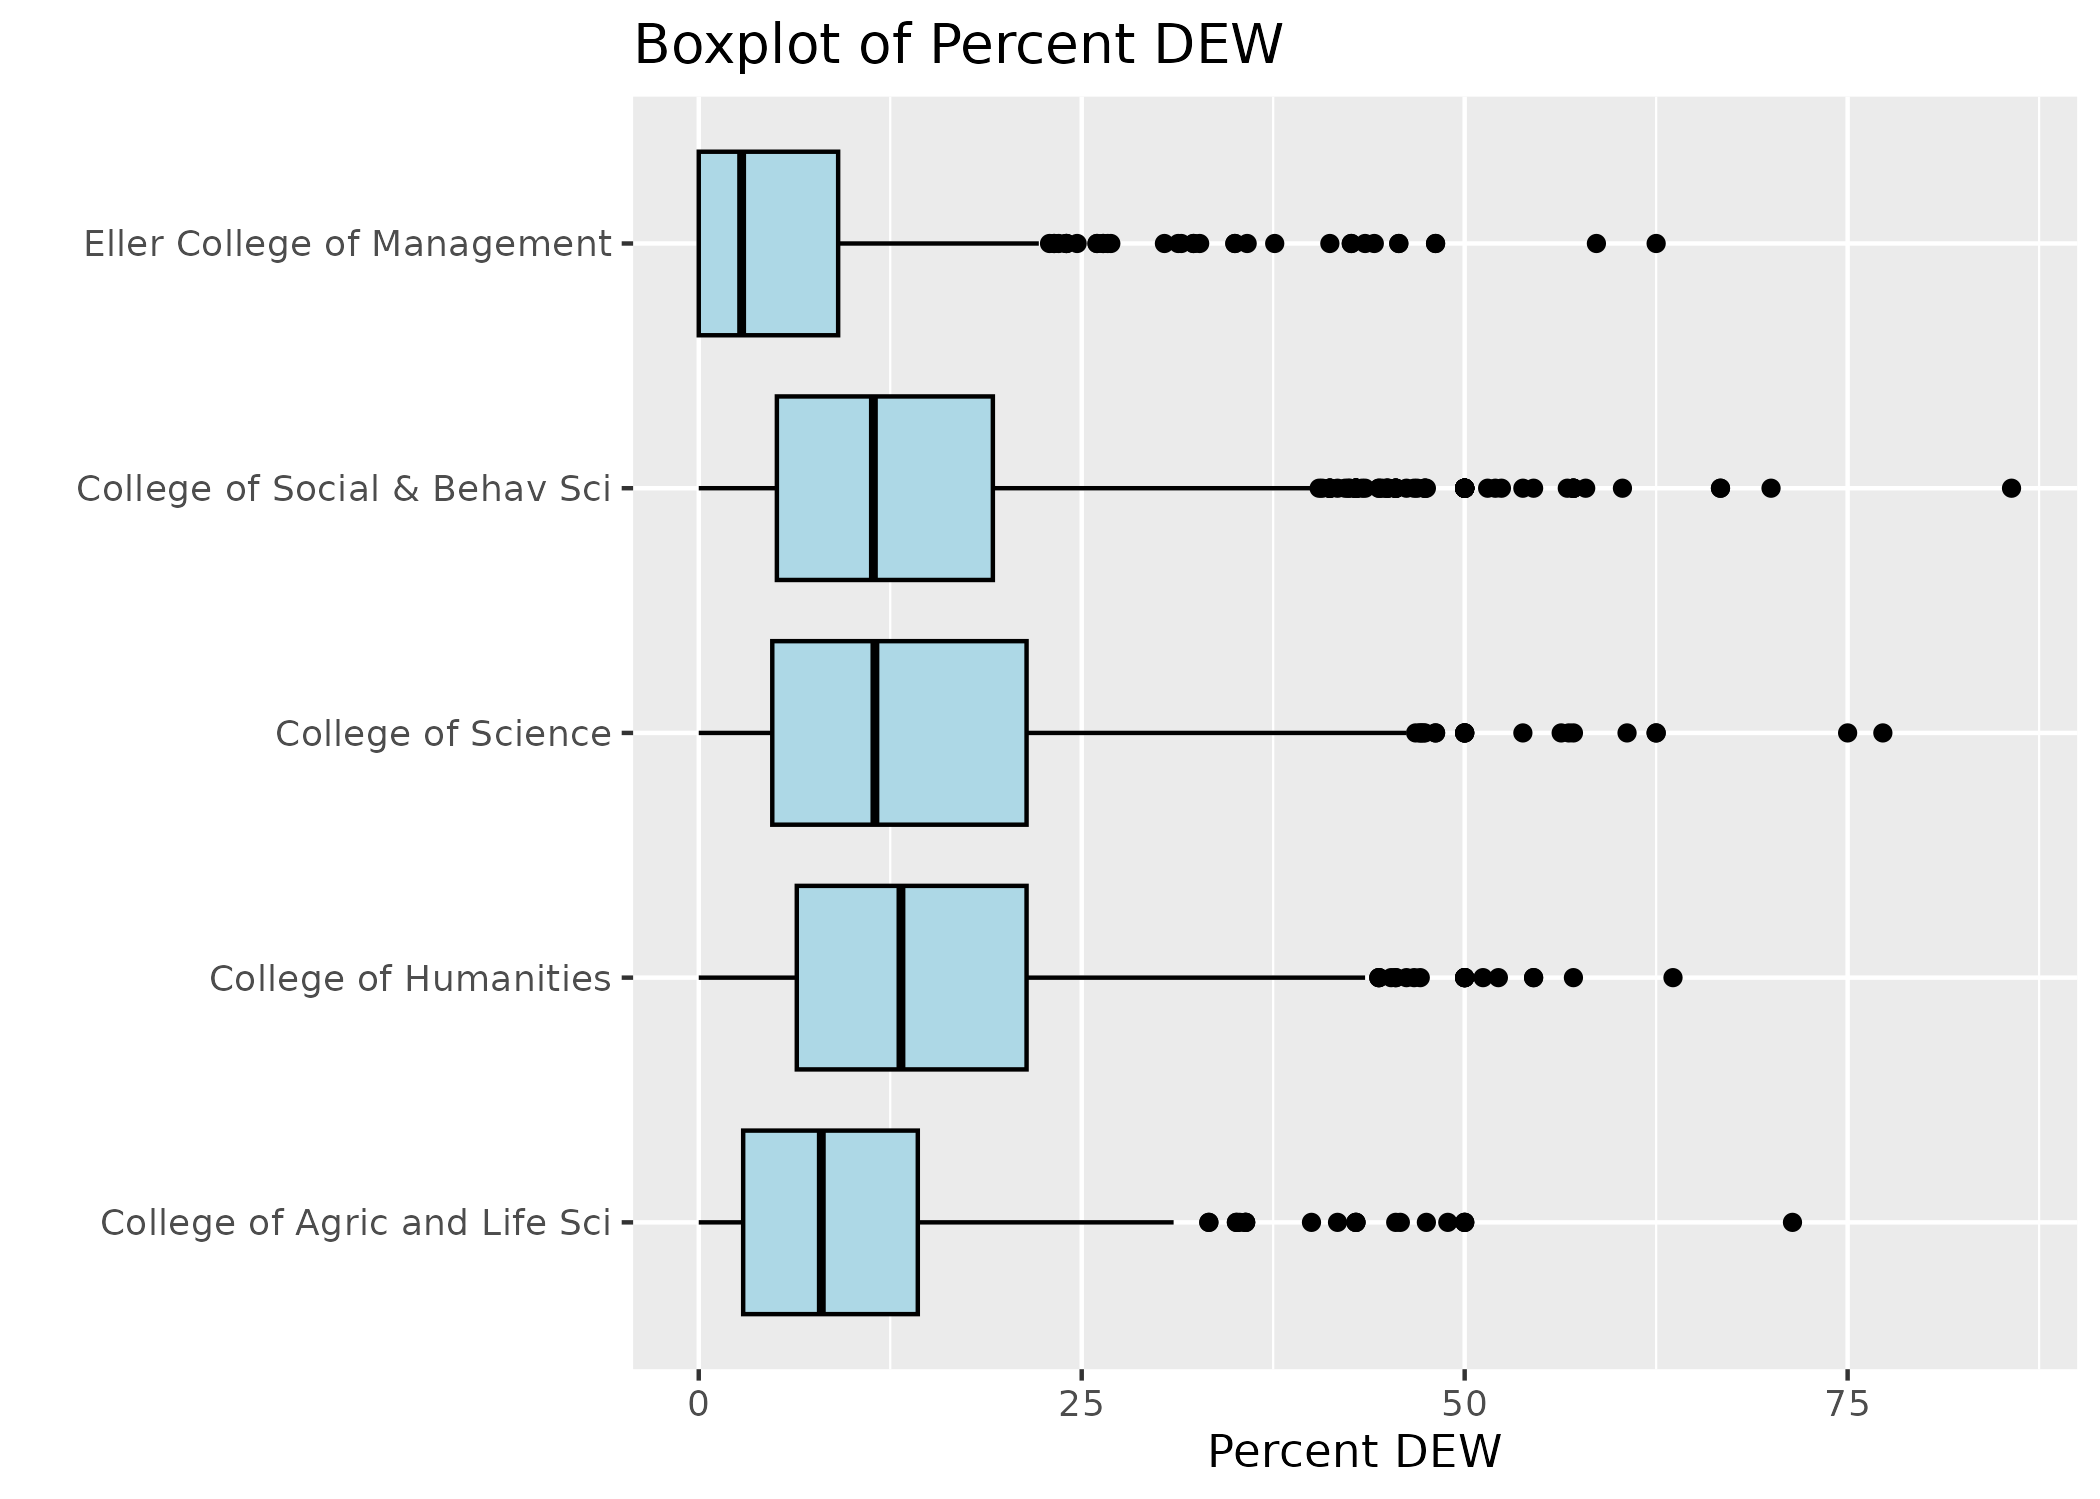
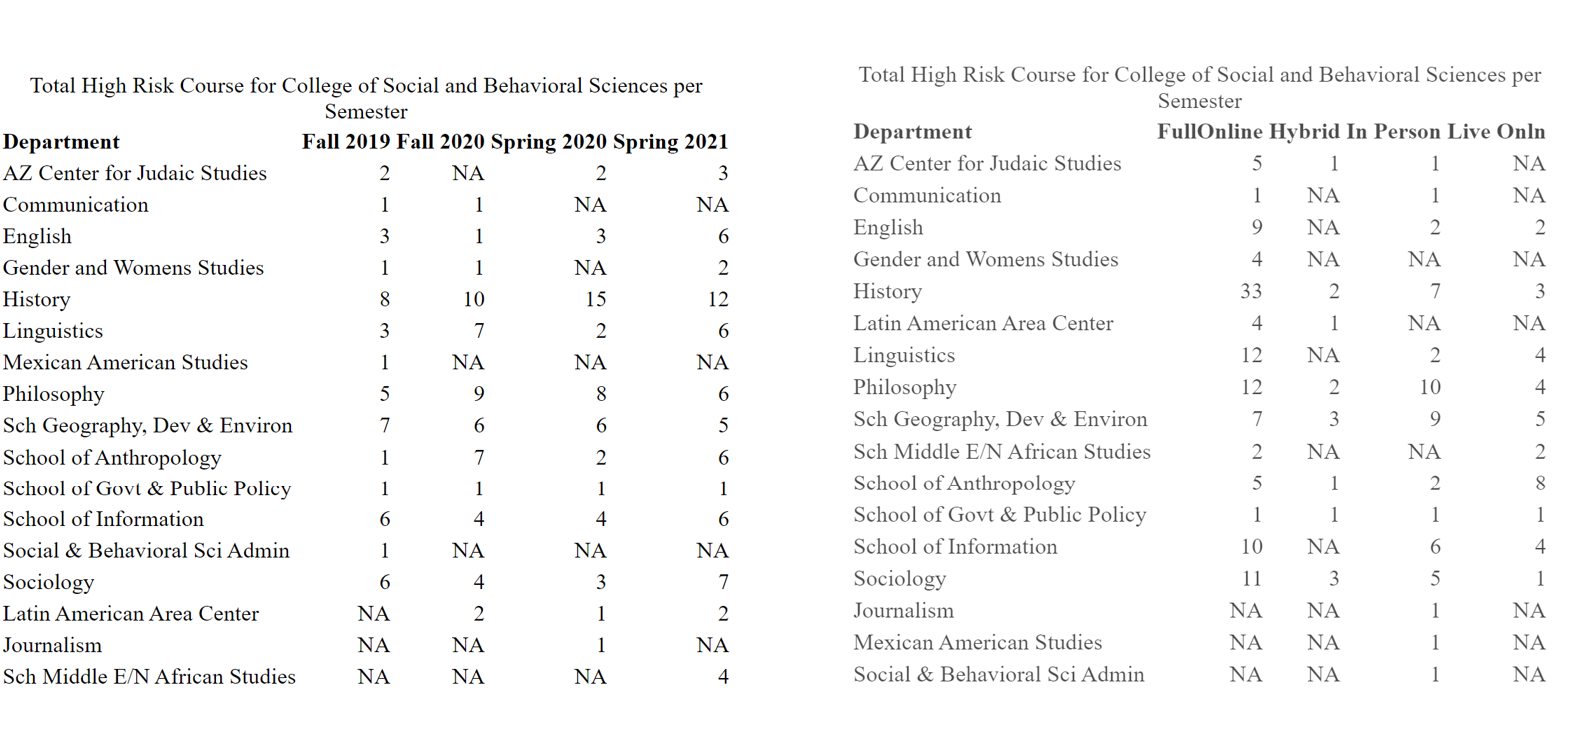
Table of High DEW Percent Courses
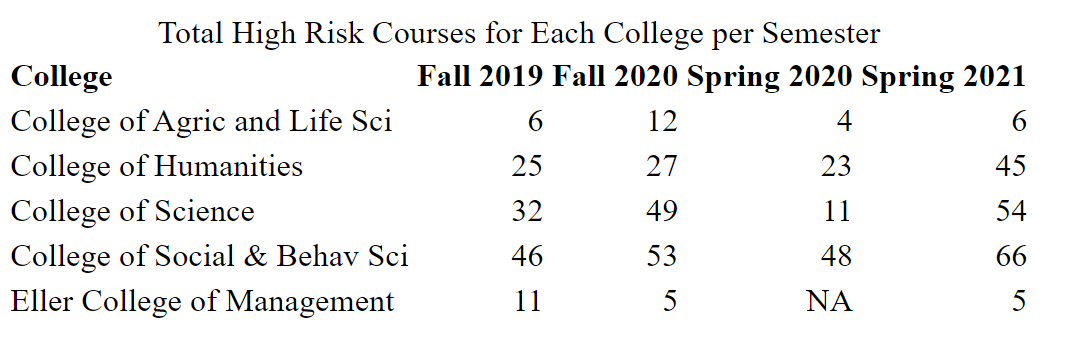
Table of High DEW Courses Social and Behavioral Sciences
Time Series Analysis
Time series analysis is a statistical method used to analyze and interpret sequential data points collected and ordered over time. It involves examining patterns, trends, and behaviors within the dataset to understand how the data evolves and changes across different time intervals.
Plot 1
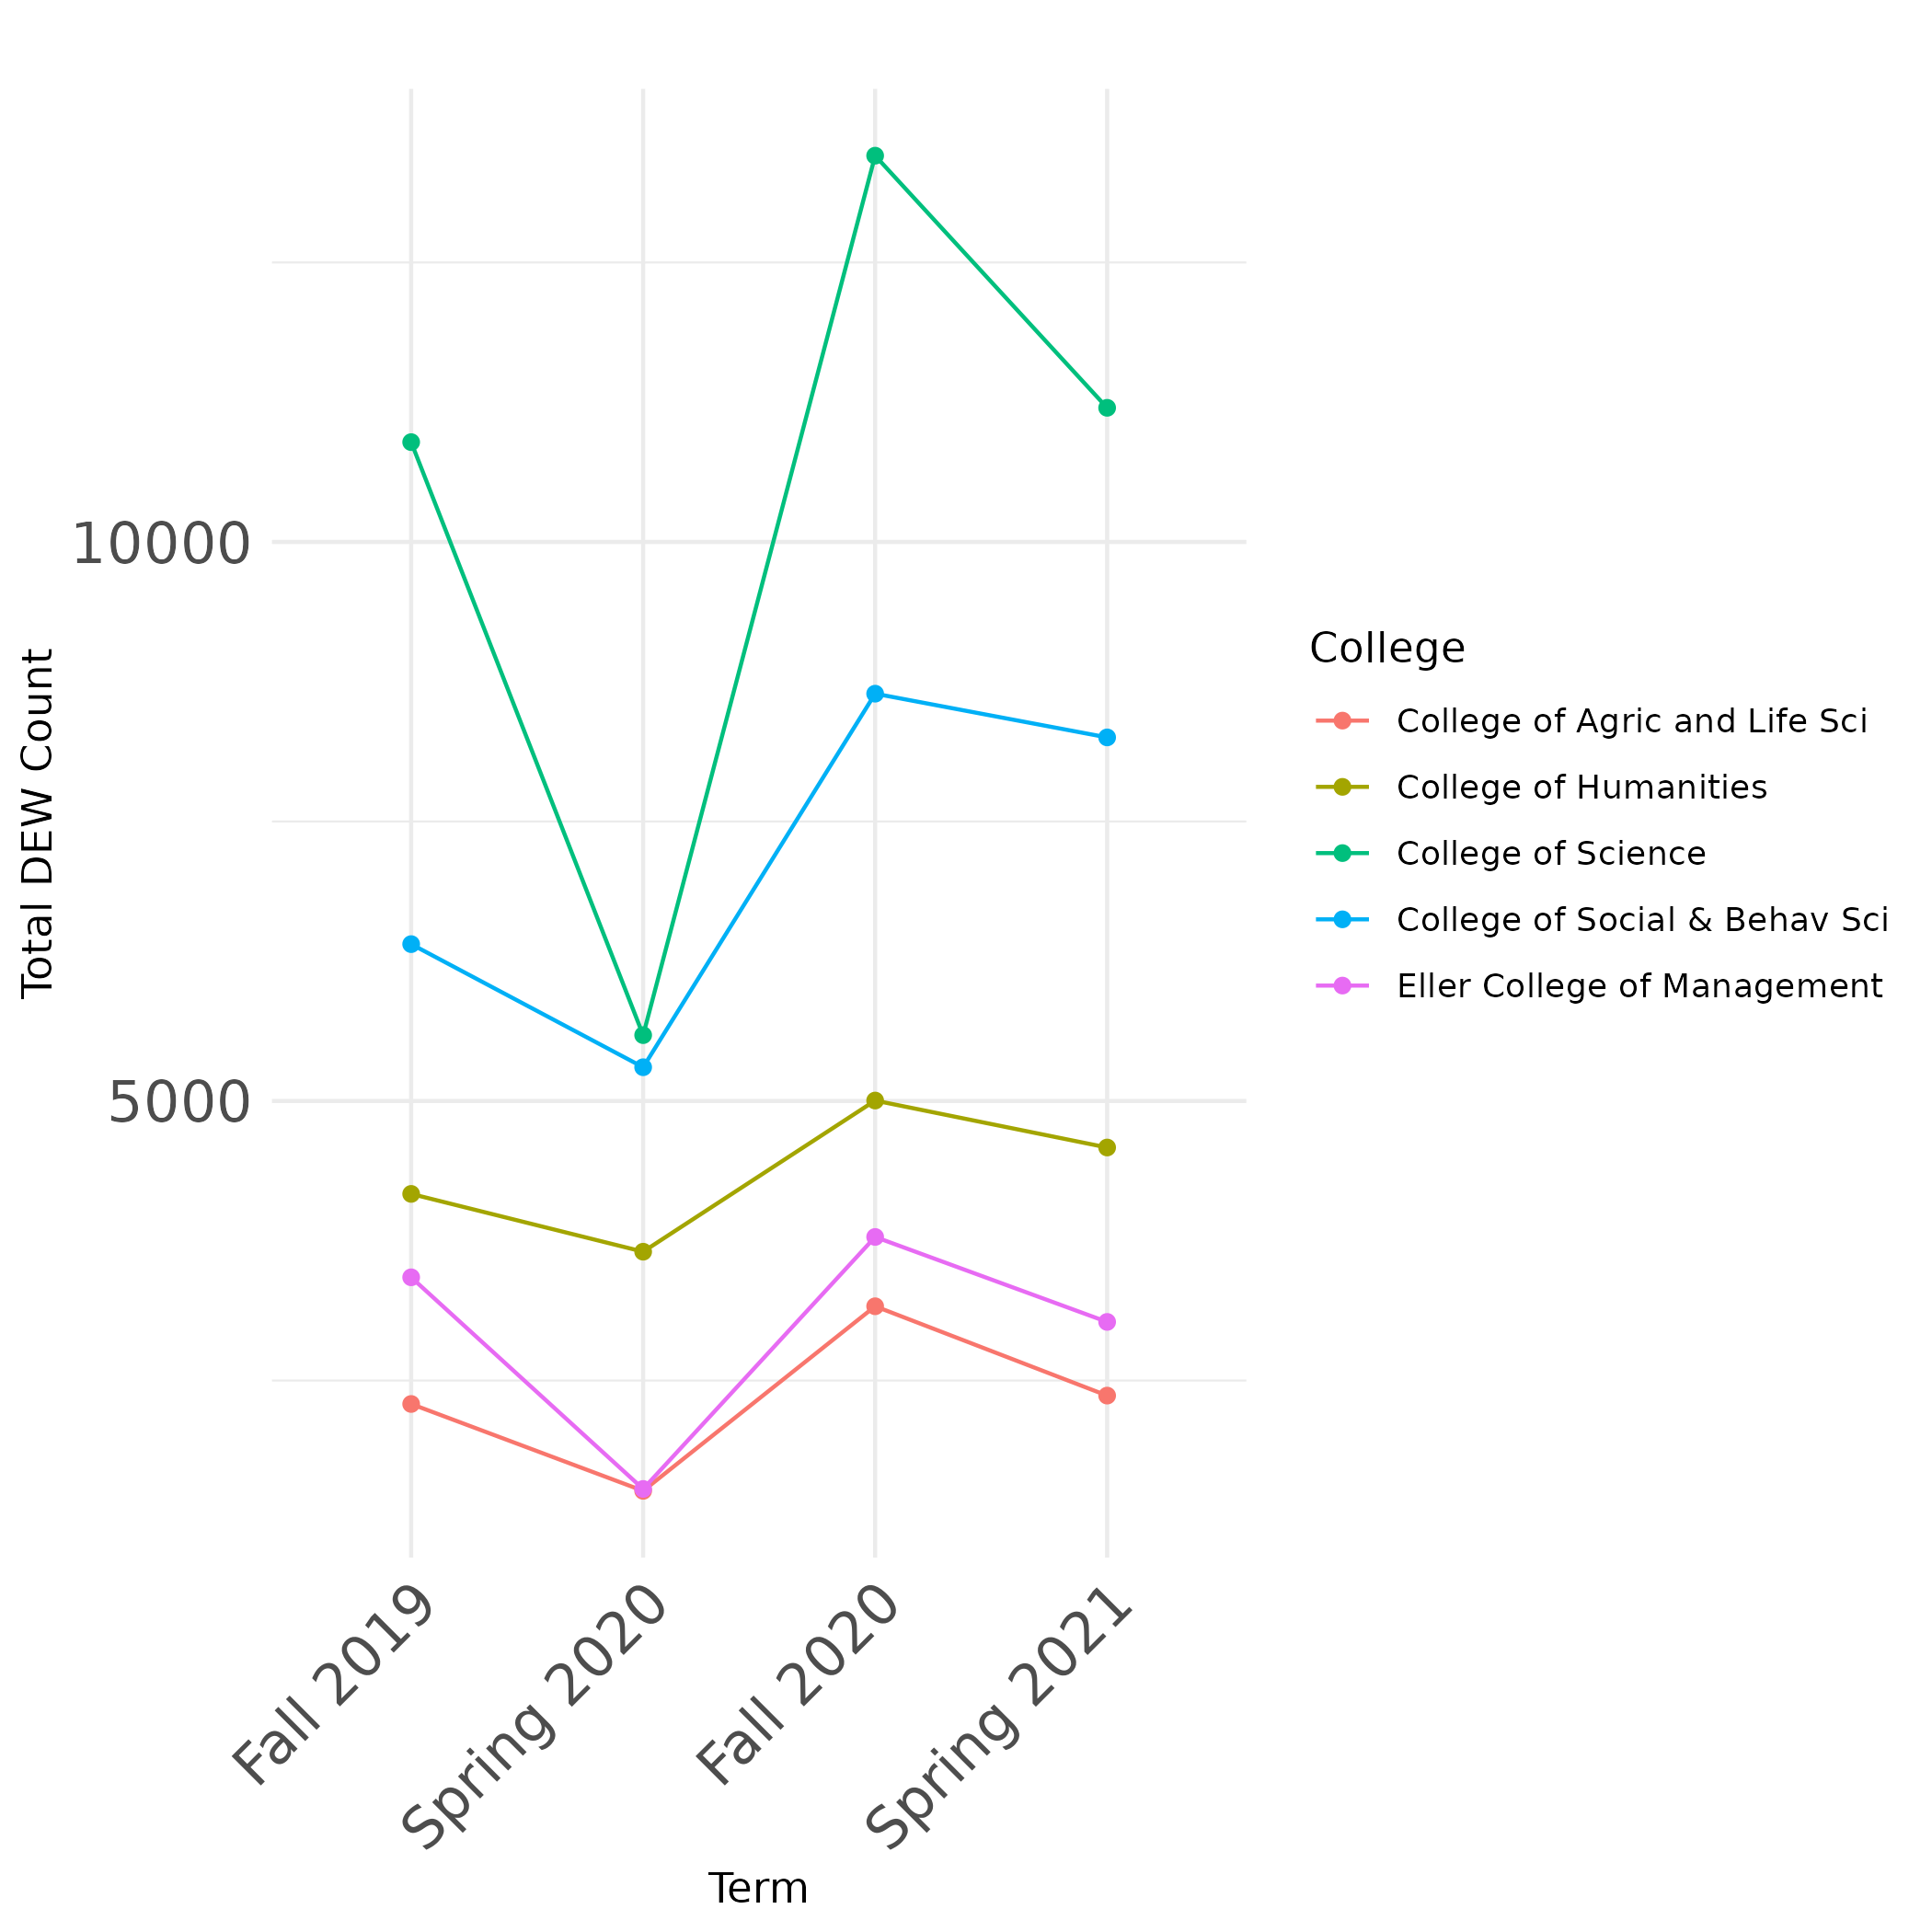
Total DEW Count for different colleges changed over different Terms
Plot 2
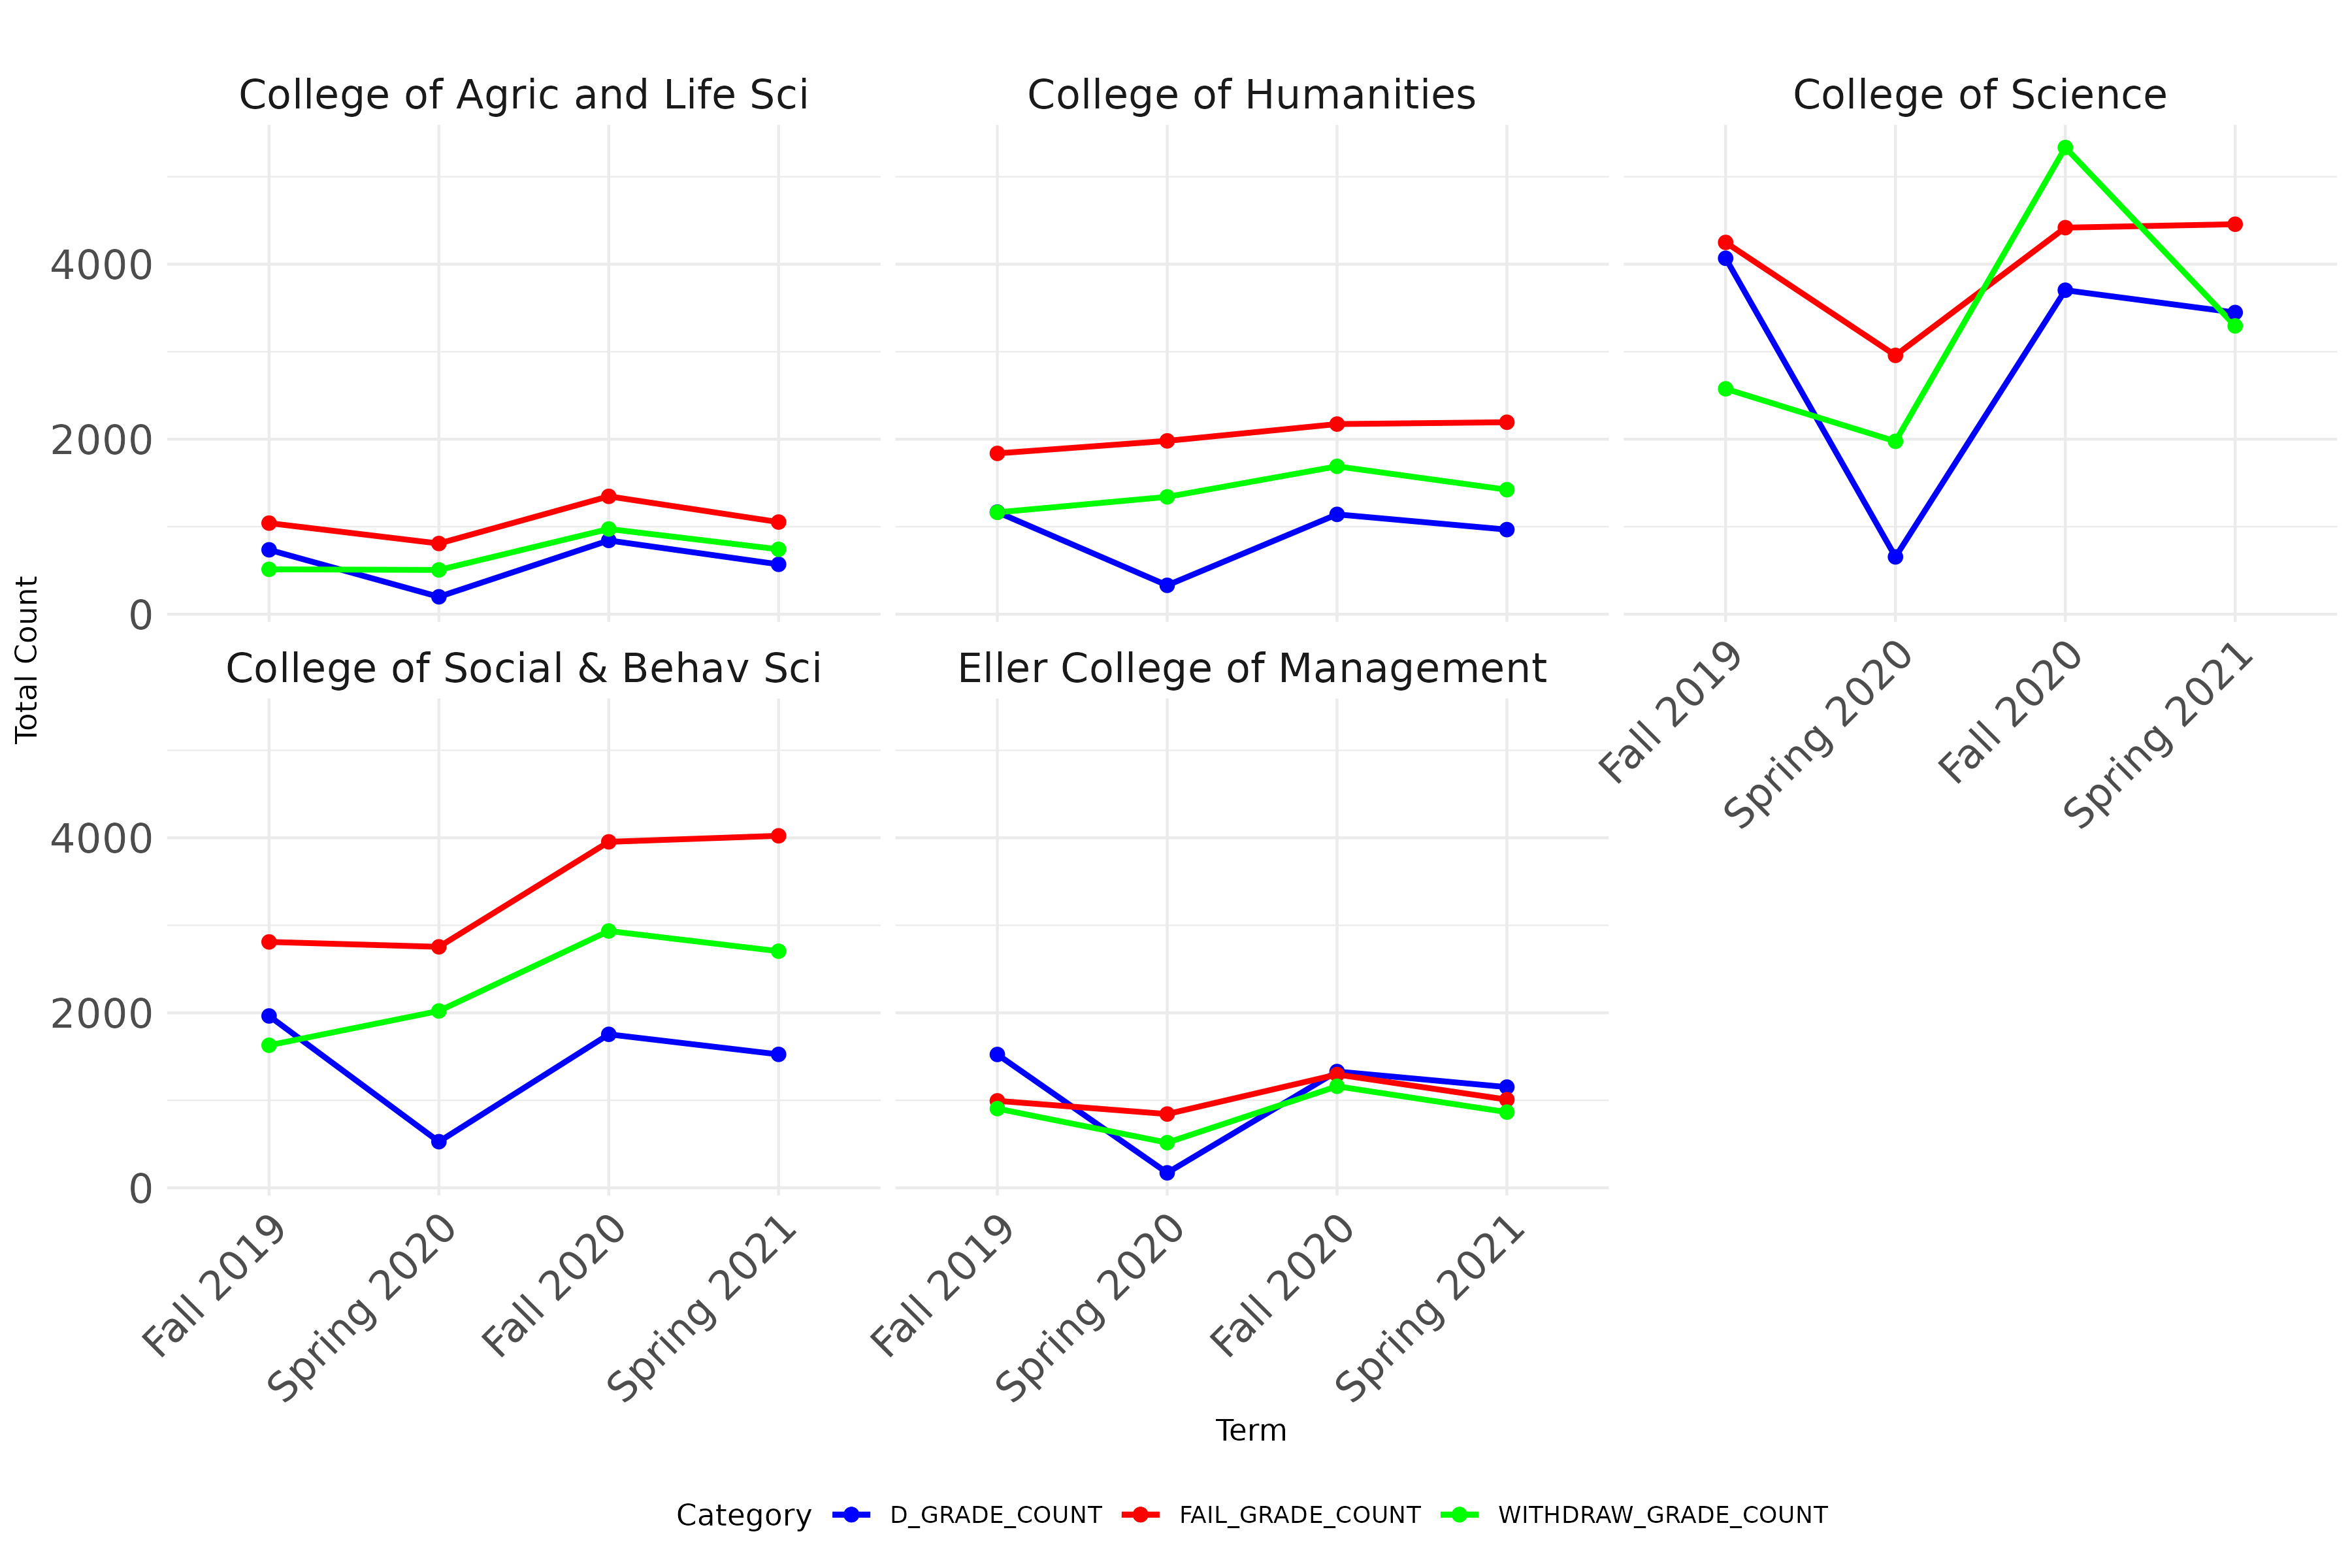
Total D, E (fail) and W (withdraw) count for different colleges changed over different Terms
Plot 3
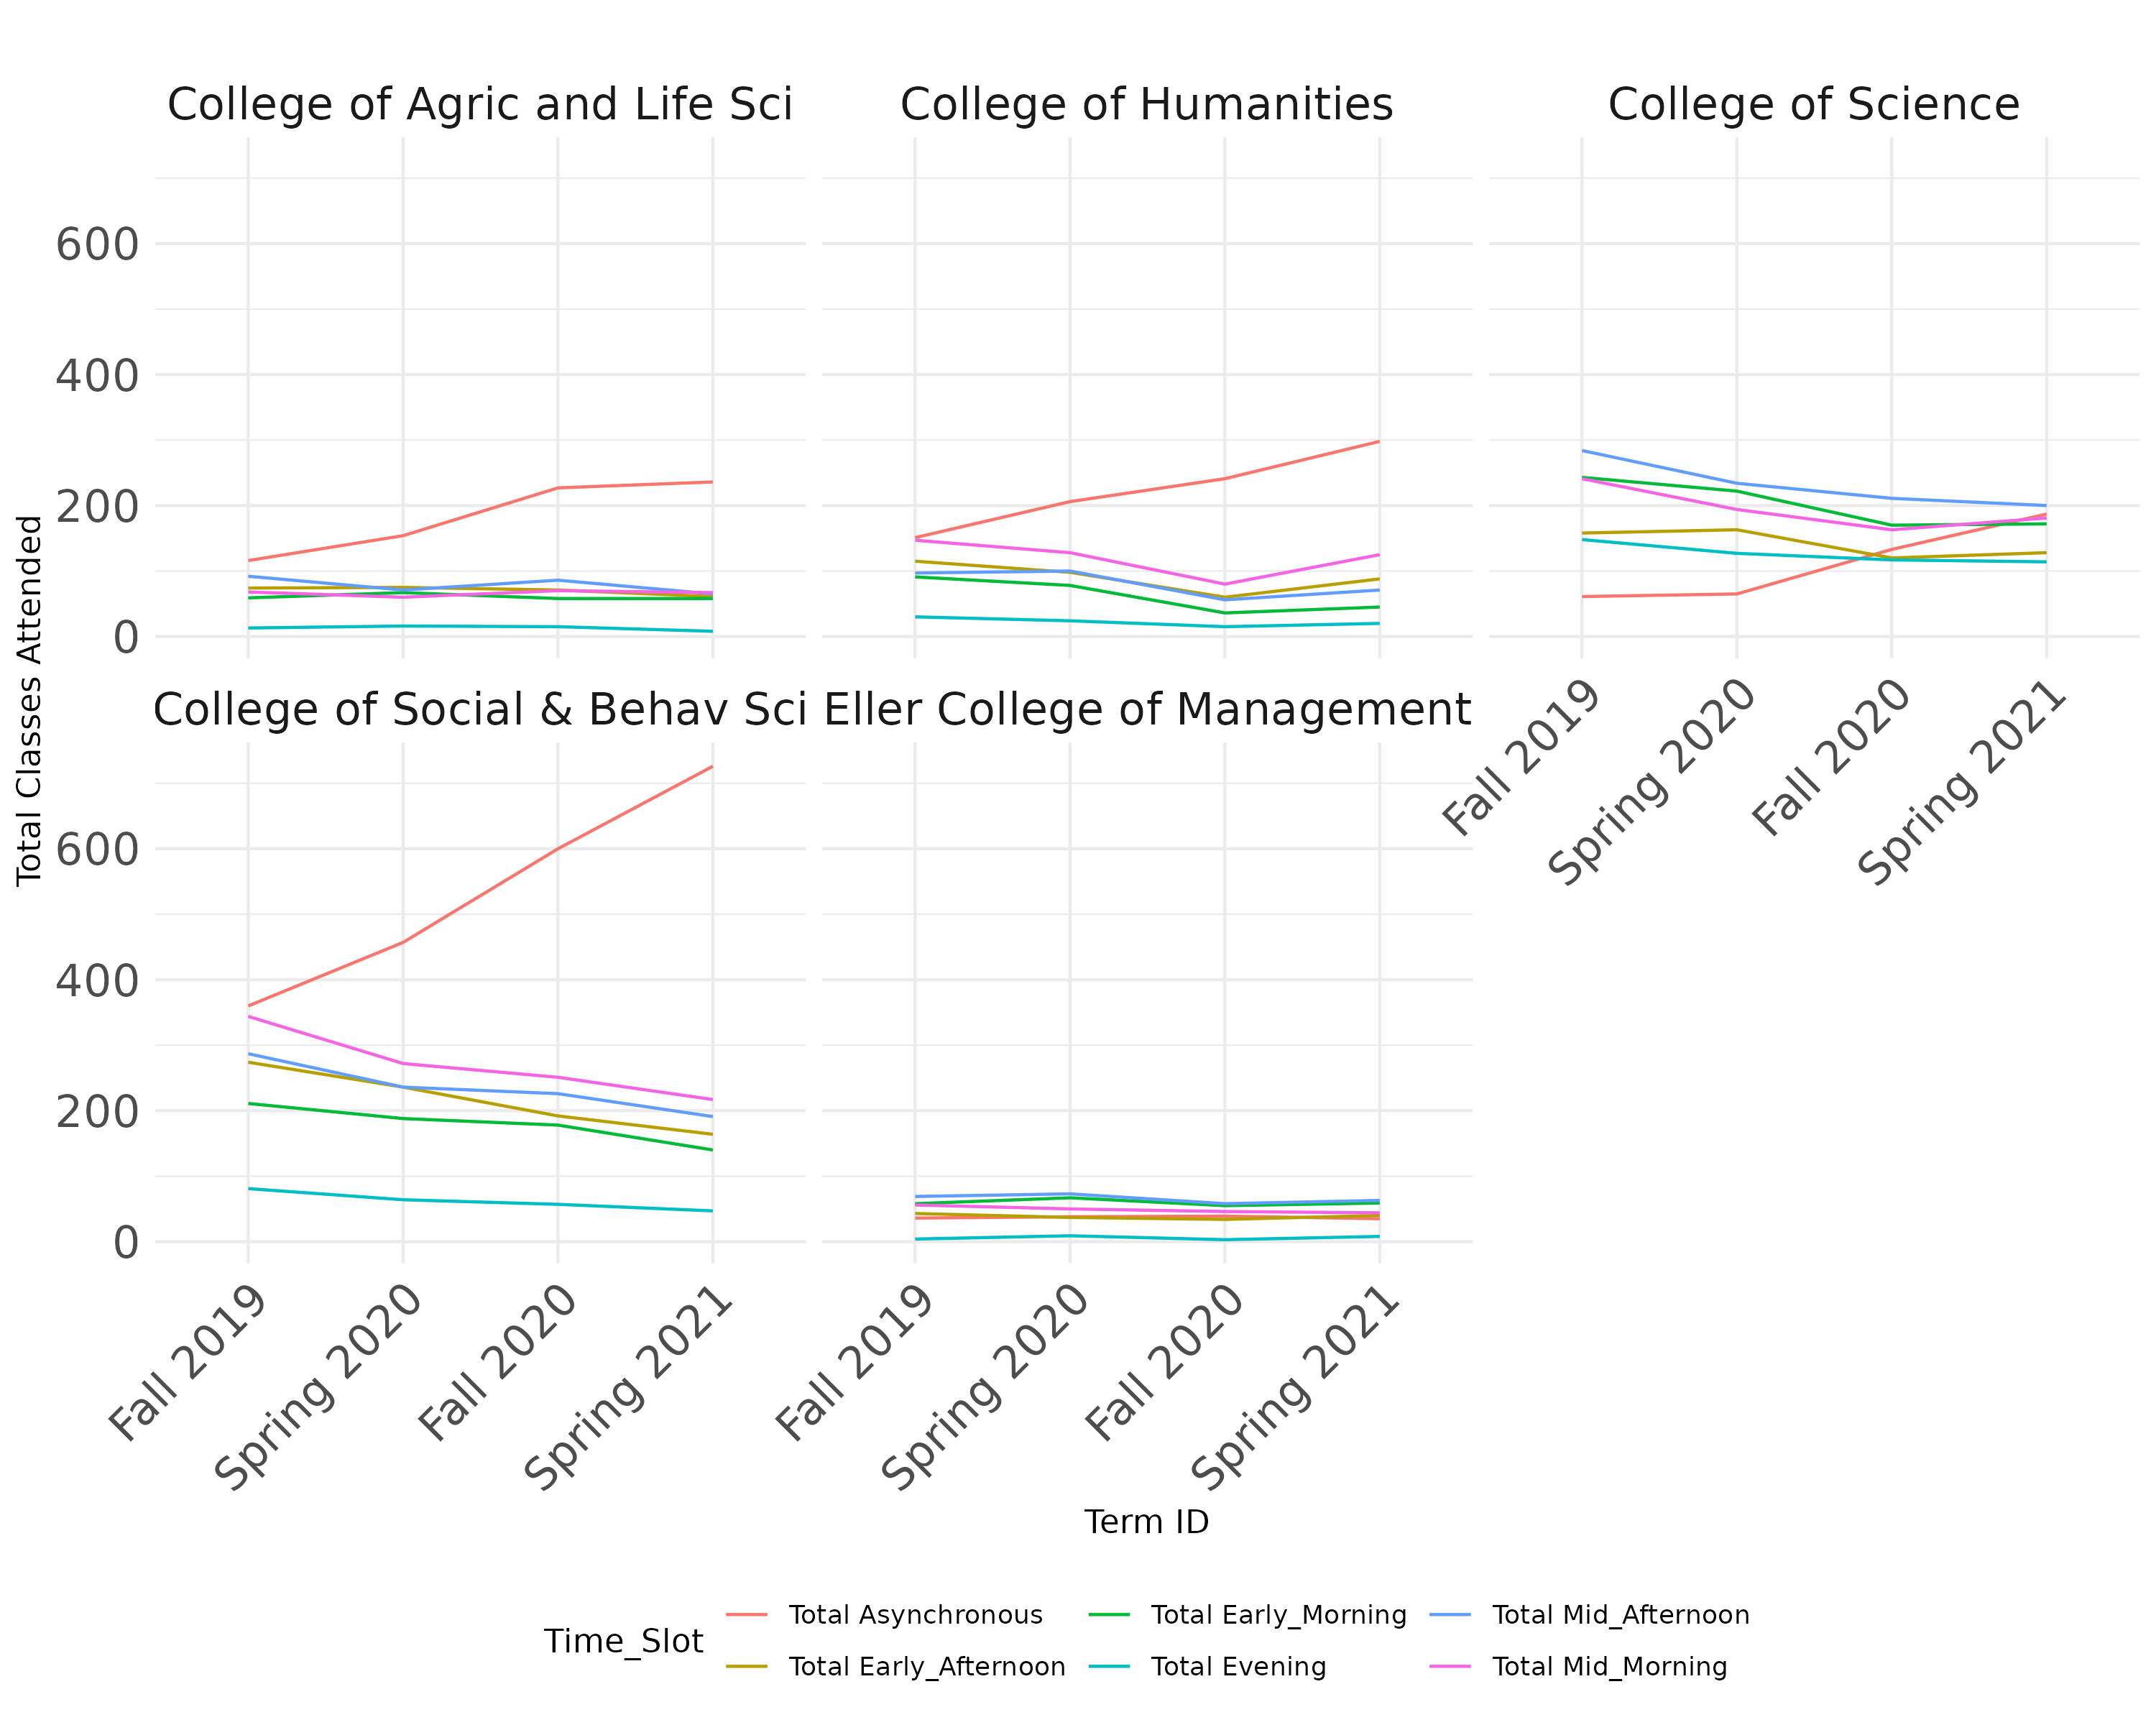
Total Classes Attended in Different Time Slots for Colleges changed over different Terms
Decision Tree
The decision tree used for predicting whether a class has a high DEW score or a low DEW score.
Code
filtered_data1 <- data %>% filter(Sections <= 1)
filtered_data1$DEW_COUNT[filtered_data1$Percent.DEW <= 12.2] <- 'Low'
filtered_data1$DEW_COUNT[filtered_data1$Percent.DEW > 12.2] <- 'High'
filtered_data1$DEW_COUNT <- as.factor(filtered_data1$DEW_COUNT)
tree_data <- select(filtered_data1, DEW_COUNT, Full_Online, Hybrid, Live_Online, Reg_Session, Monday, Tuesday, Wednesday, Thursday, Friday, Saturday, Sunday, Early_Morning, Mid_Morning, Early_Afternoon, Mid_Afternoon, Evening, Asynchronous )
col_names <- c("Full_Online", "Hybrid", "Live_Online", "Reg_Session", "Monday", "Tuesday", "Wednesday", "Thursday", "Friday", "Saturday", "Sunday", "Early_Morning", "Mid_Morning", "Early_Afternoon", "Mid_Afternoon", "Evening", "Asynchronous" )
tree_data[col_names] <- sapply(tree_data[col_names], as.logical)
tree_default <- tree_data |>
rpart( DEW_COUNT~., data = _)
rpart.plot(tree_default)
Plot
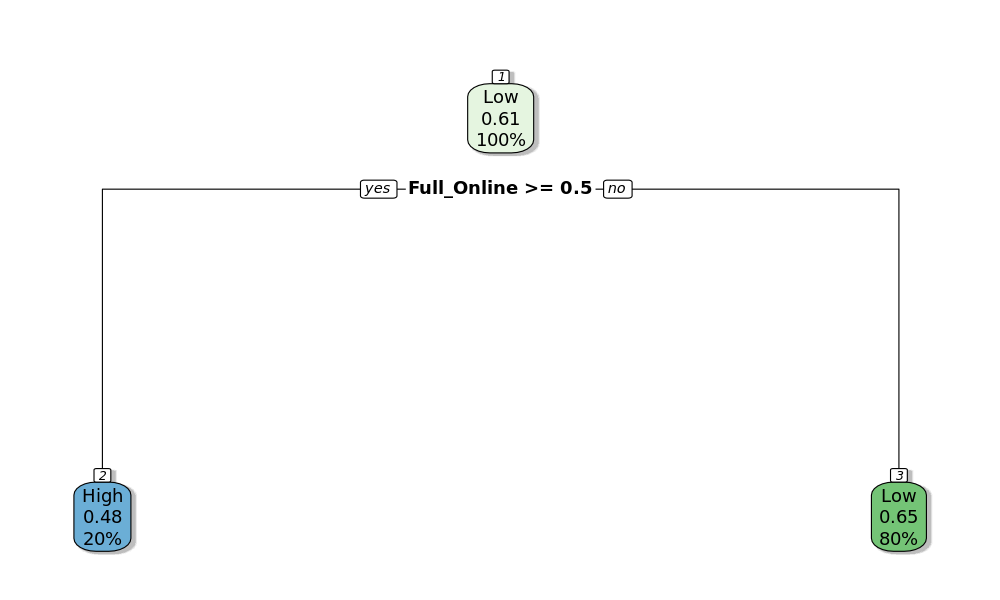
The decision tree predicts “High” if Full_Online is >= 0.5; otherwise, it predicts “Low.” Tree building stops when additional splits don’t significantly improve performance or when there are insufficient observations for further splitting.
Regression
Feature Selection using College of Social and Behavioral Sciences
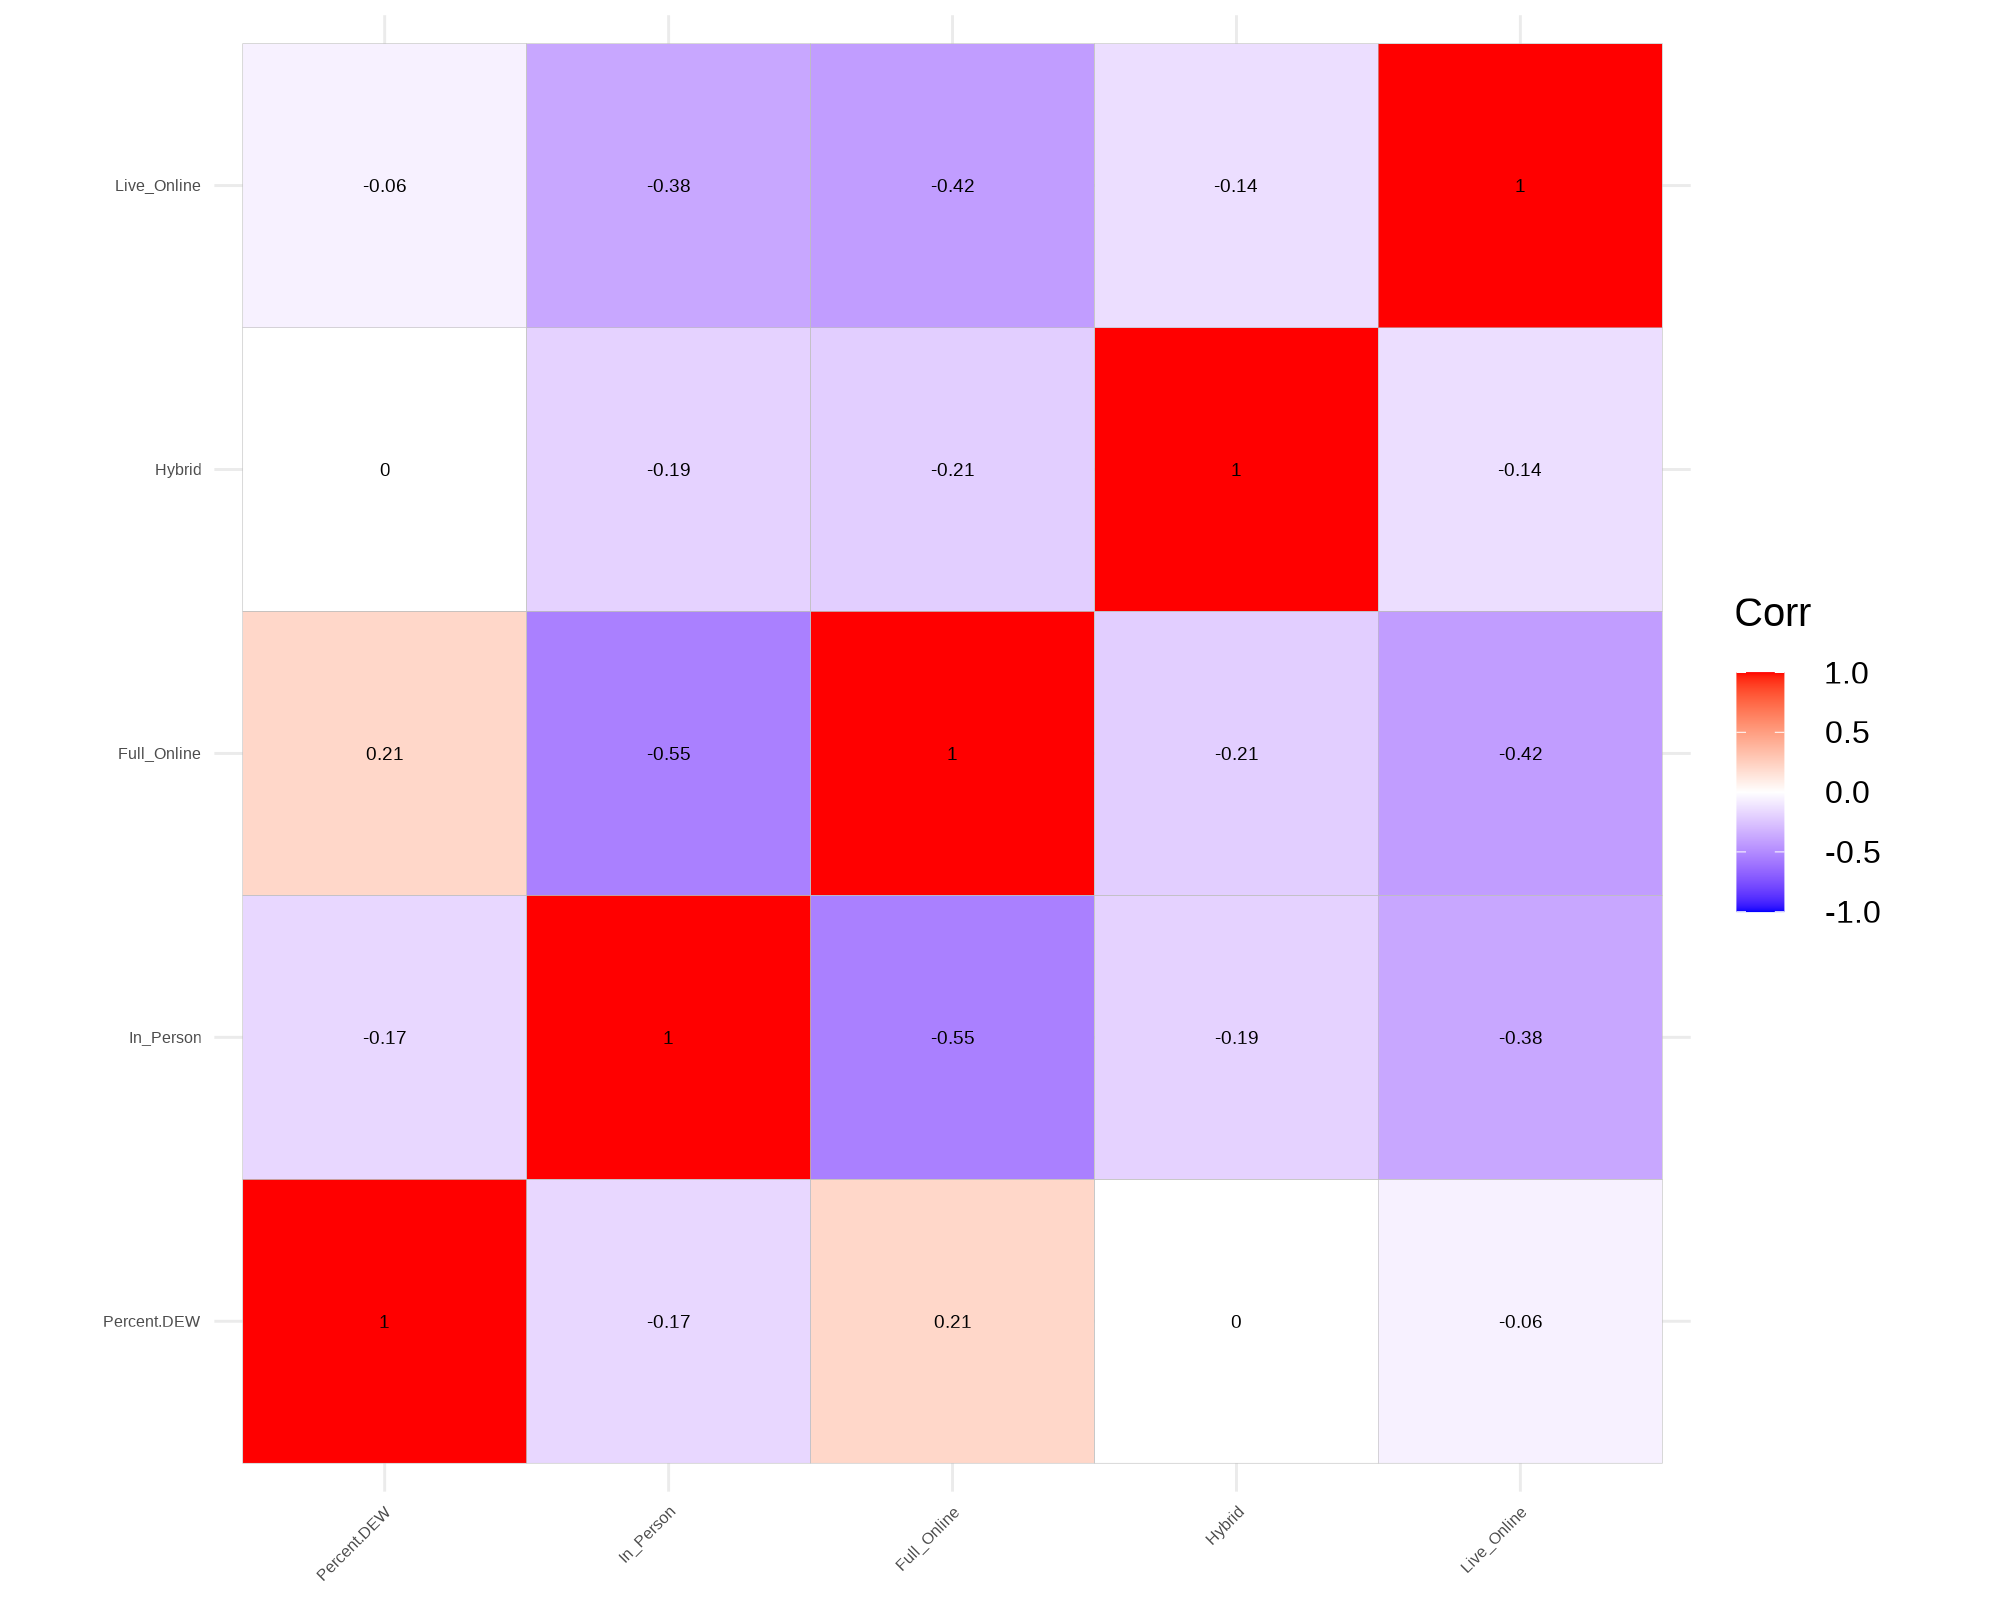
Correlate - Mode of Class
Correlation of Percent DEW, In- Person, Full Online, Hybrid, Live-online
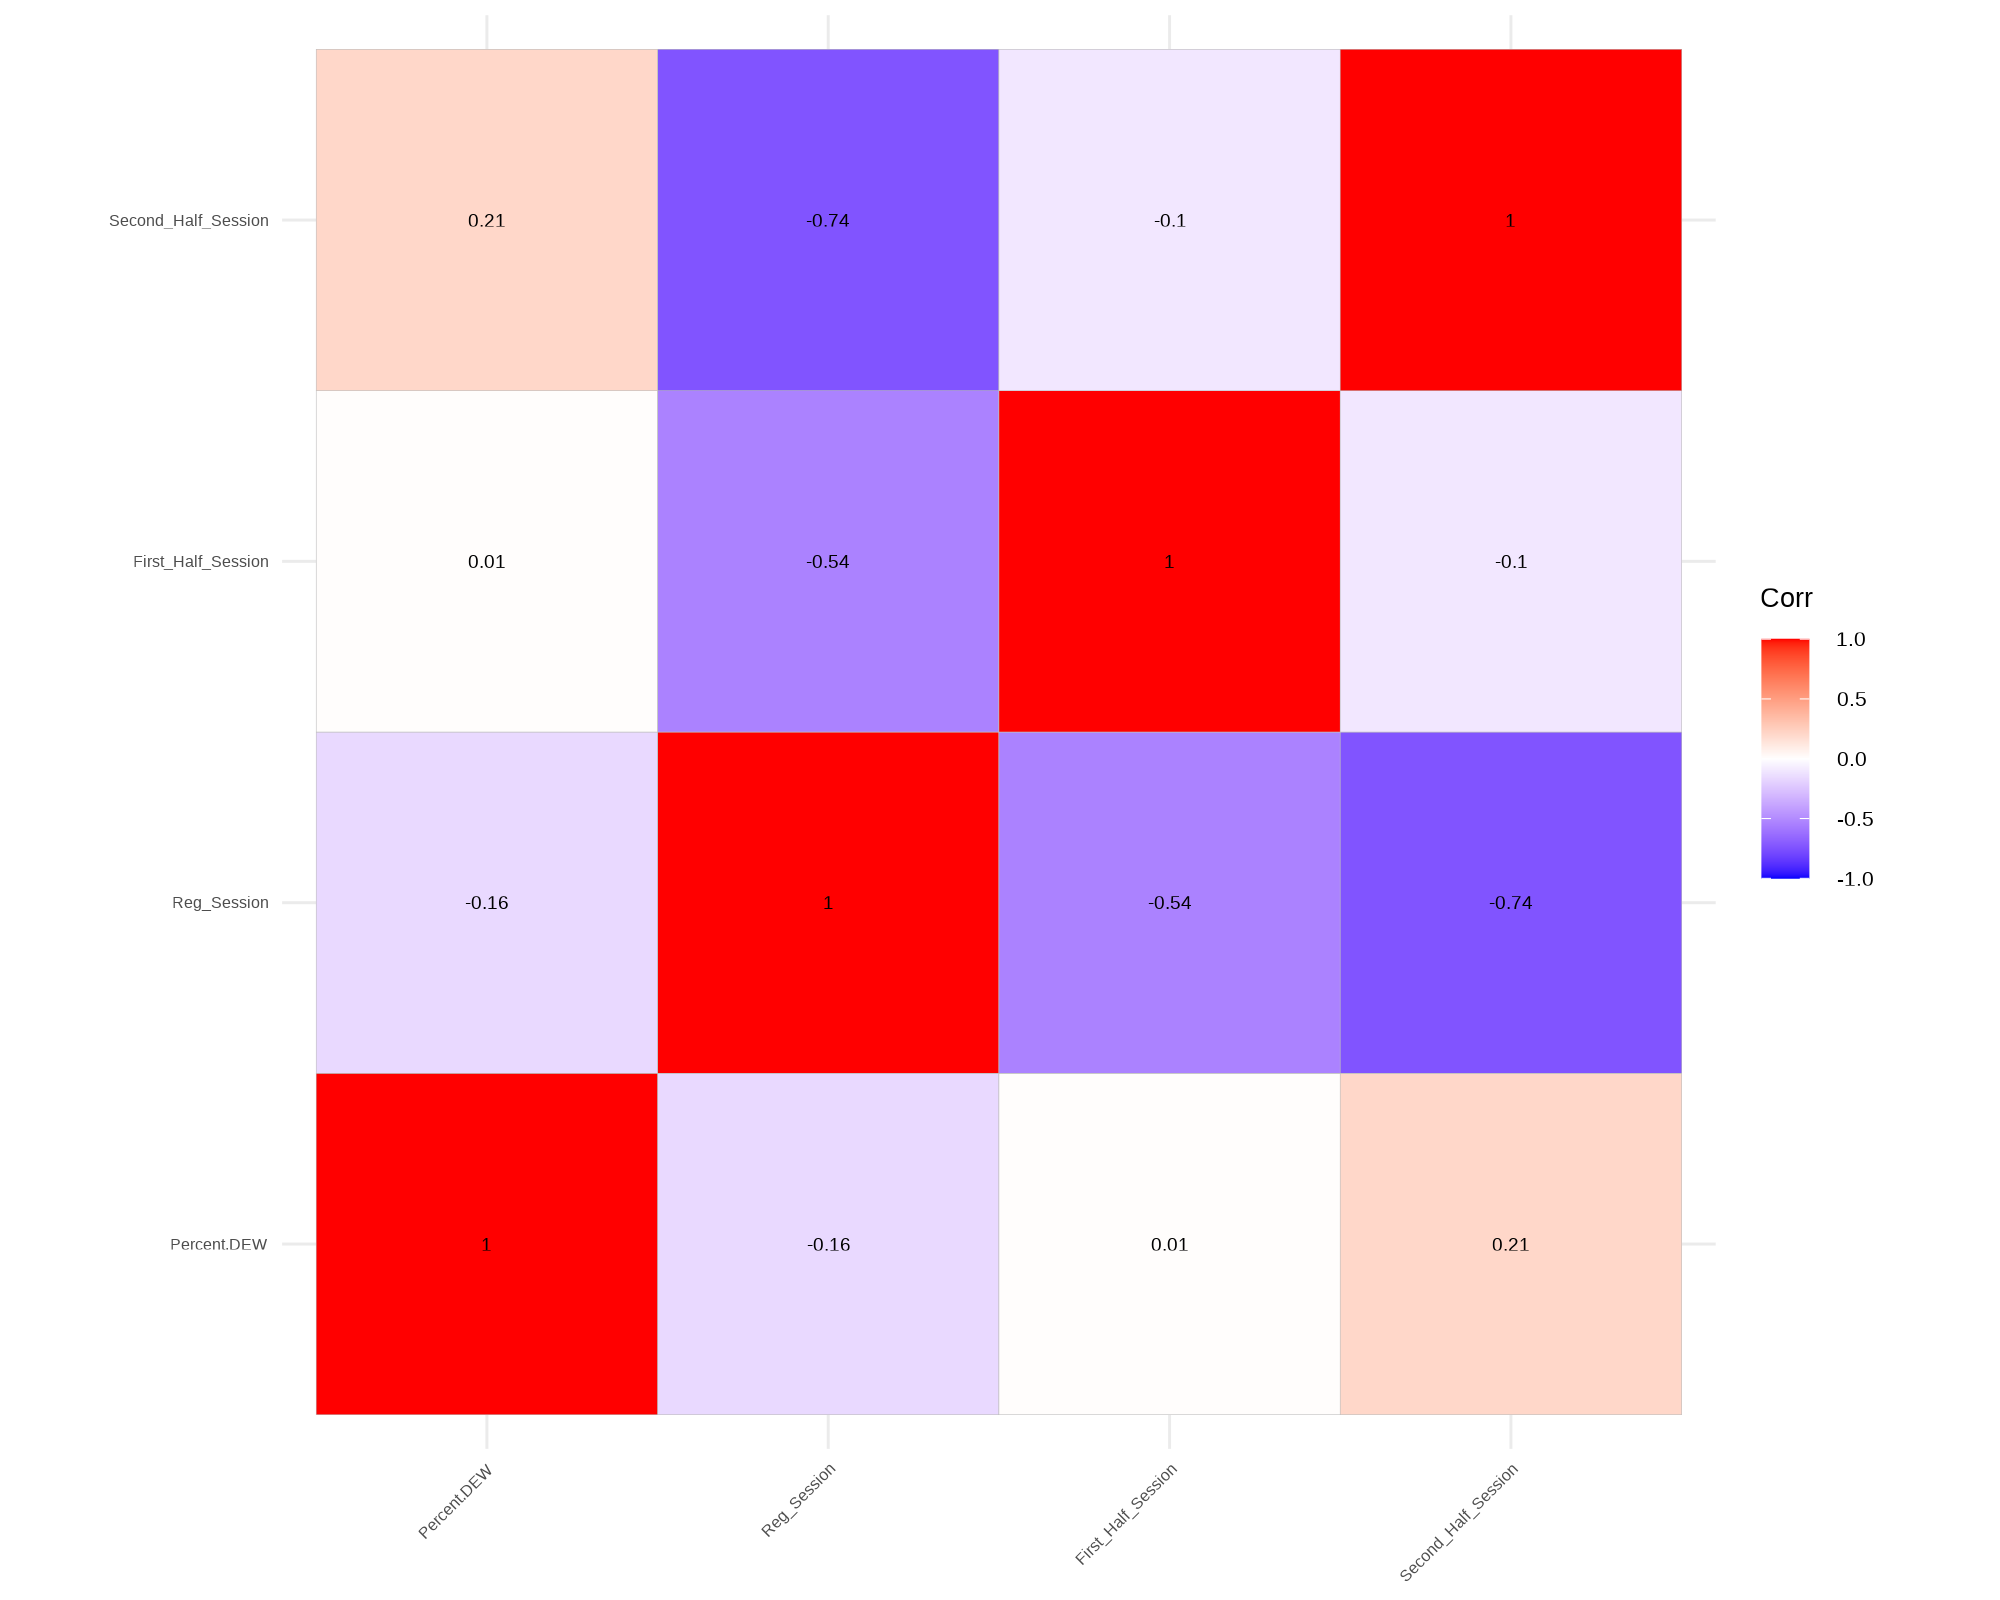
Correlate - Sessions
Selected Features
- Percent.DEW
- Full_Online
- Second_Half_Session
Multilinear Regression
{r}
# Perform multiple linear regression
model <- lm(Percent.DEW ~ Second_Half_Session + Full_Online, data = model_data)
# Create a linear regression model specification
lin_reg_spec <- linear_reg() |>
  set_engine("lm")
# Fit the model to the training data
lin_reg_fit <- lin_reg_spec |>
  fit(y ~ X, data = train_data)
# Apply model to the test set
y_pred_test <- predict(lin_reg_fit, new_data = test_data) |>
  pull(.pred)
Predicted Function
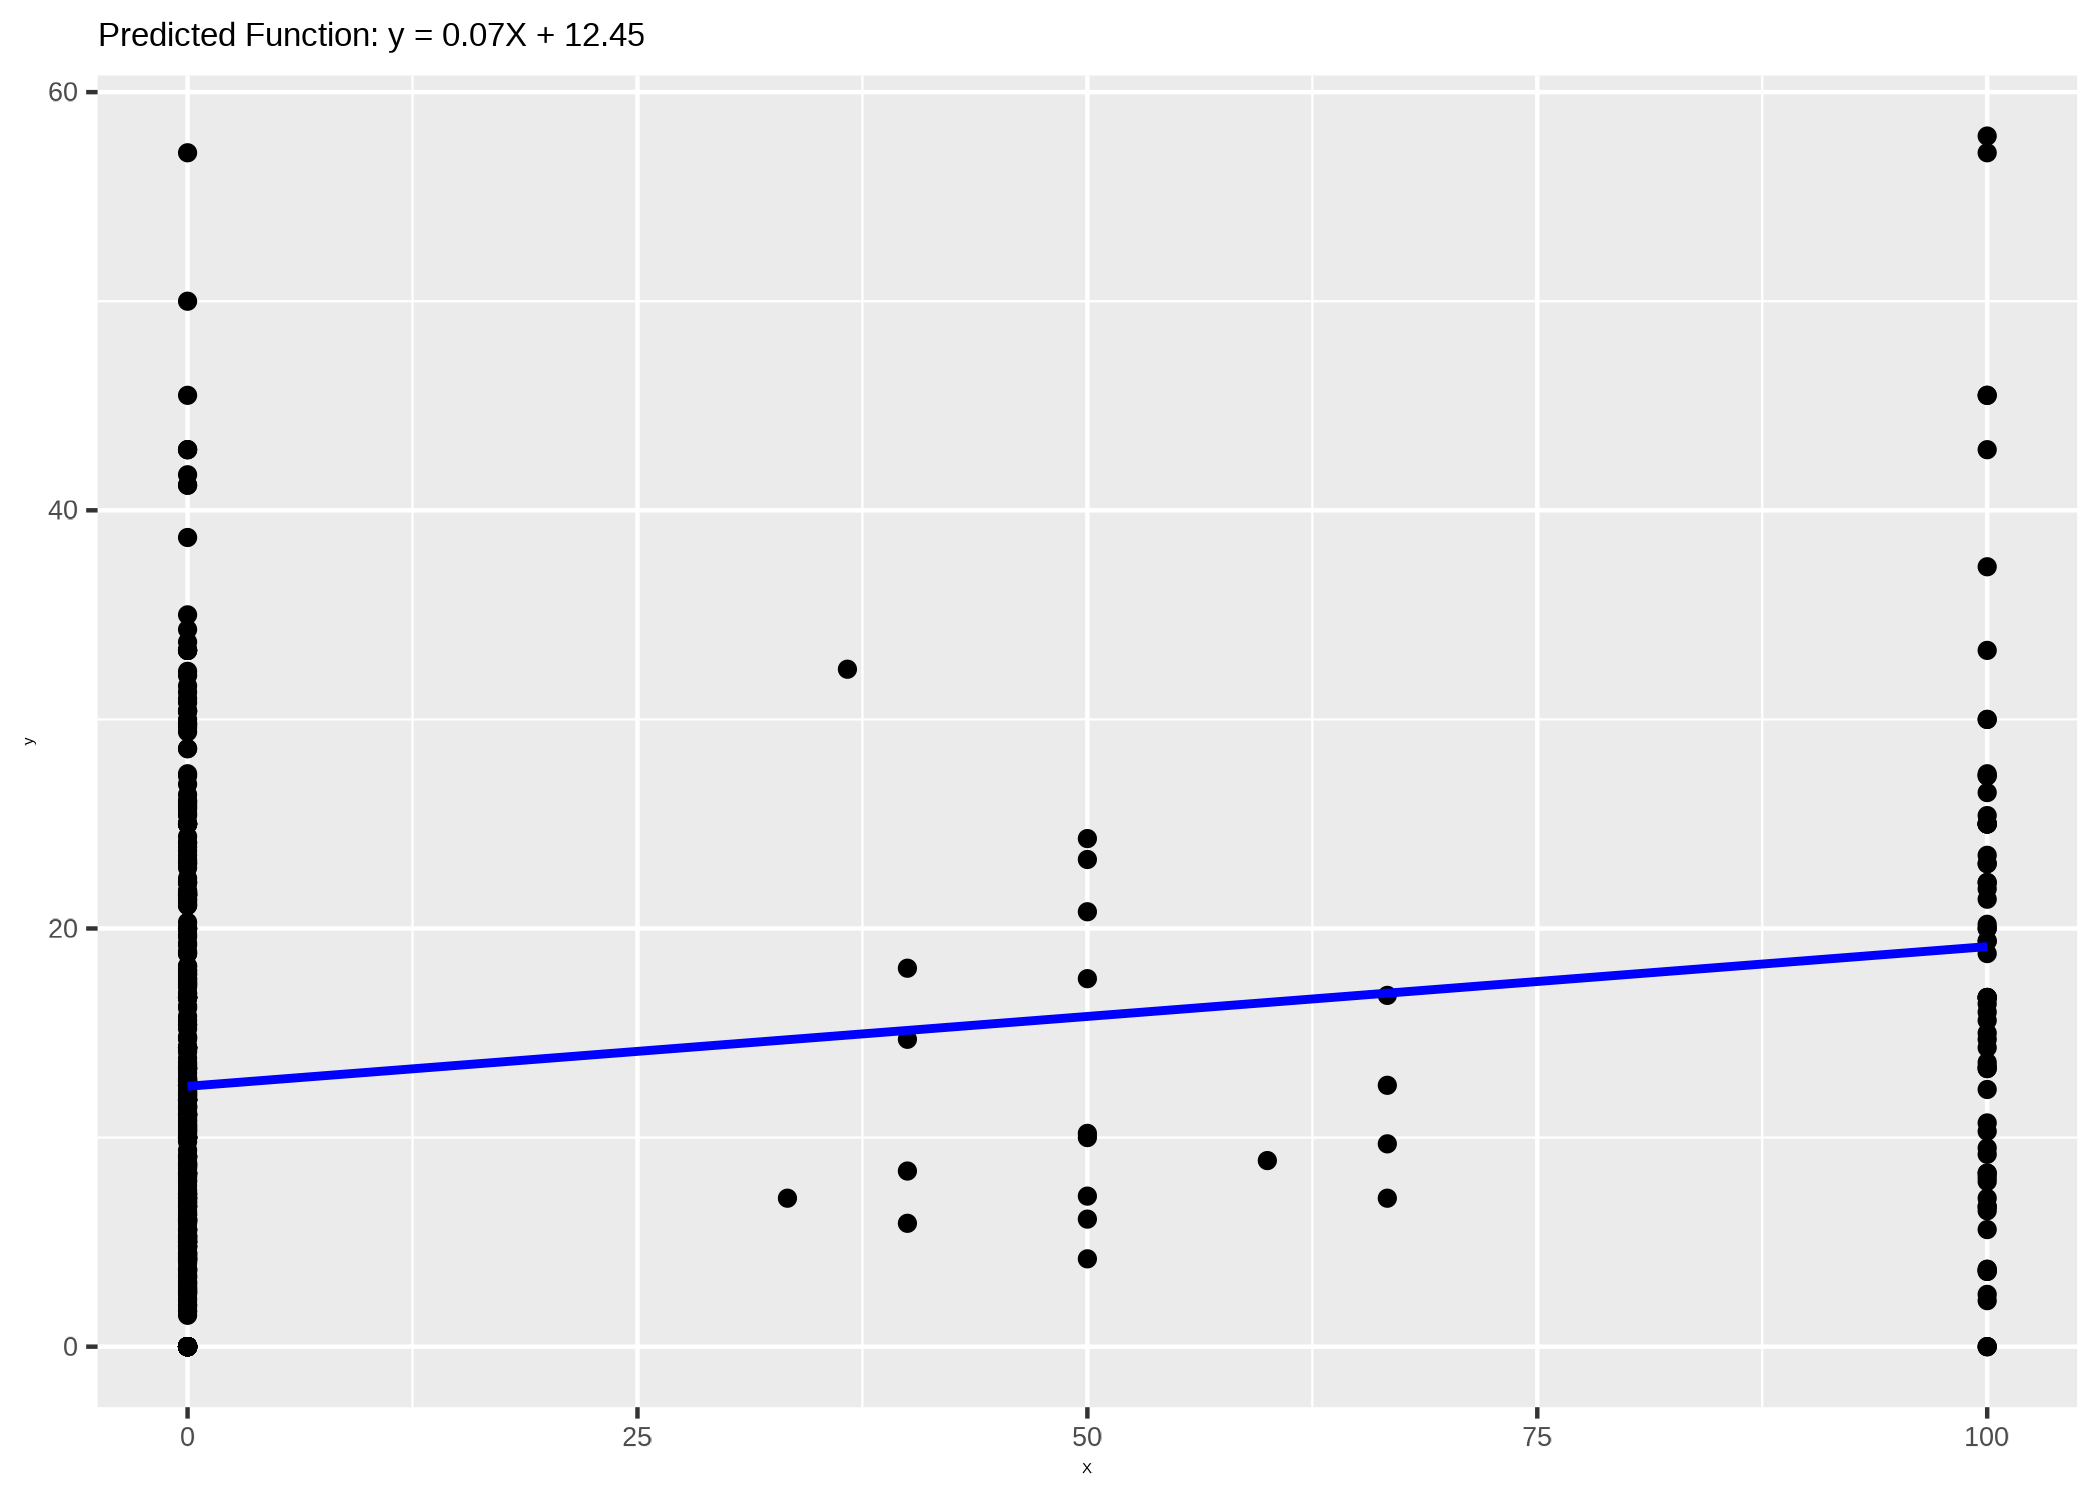
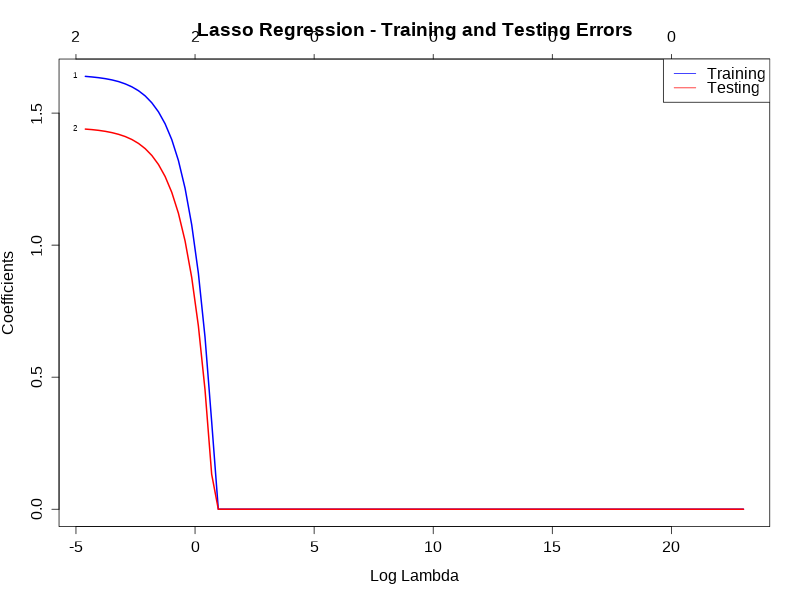
Lasso Regression
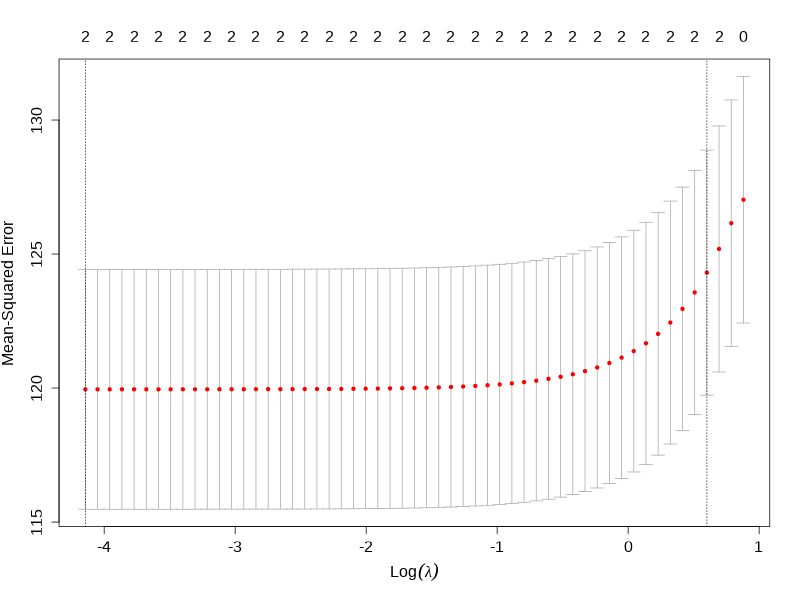
Lasso - Training and Testing Error