Descriptive Analysis of Grade Outcomes Report
INFO 523 - Project Final
Abstract
There is a lack of understanding of how higher education has been impacted by the Corona virus global pandemic. This study aims to explore grade outcomes for students at a level one research institution before, during, and after this public health emergency. An exploratory data analysis will examine and compare grade values outcomes by college, department, and division level. Anomaly detection indicated that the College of Social and Behavioral Sciences observed the greatest number of high DEW percentage courses. A time series analysis indicated that the lowest DEW percentages were observed during the first semester of the pandemic followed by the highest levels of DEW percentage courses in the next semester. A decision tree analysis found that fully online courses are a key factor in determining whether a course will be above average for the DEW percent. A regression analysis found a correlation between the DEW percent and fully online classes as well as classes offered in the second half session of a semester. An accurate predictive model was unable to be constructed during the course of this study. However, future research that extends the time frame of the data and includes more fine-grained data could yield further insights regarding relationships between grade value outcomes and course attributes.
- All coding and additional visualizations can be found on the corresponding tab on this website
Introduction
Low college student success rates have a significant impact on higher education institutions' academic offerings, their ability to provide financial support and scholarships, as well as their professional reputation. The current study aims to contribute to the knowledge domain by conducting a detailed examination of the course grade value outcomes at the University of Arizona (U of A) before, during, and after the pandemic. These patterns and trends may be discovered that might help guide the U of A stakeholders in enhancing their understanding of student development and thus improving support services in the future. The analysis will break down the grade value outcomes by college, department, division level, and course level. Anomalies will be isolated for a more fine-grained inspection that includes time series analysis, decision trees, and regression techniques. These course attributes will be used in an effort to create a model for predictive grade value outcomes.
Thus, the high-level goal of the current study is to analyze and understand the grade value outcomes at the U of A before, during, and after the COVID-19 pandemic. This investigation revolves around two primary questions:
- Pattern Analysis – What if any patterns or relationships exist between colleges, departments, or course level and grade outcomes for enrolled students?
- Predictive Modeling – Can a predictive model be developed that accurately forecasts grade outcomes based on course attributes?
Data
The current study is supported by two data sets. The first data set, referred to as DEW Rates (where ‘D’ stands for D-grade, ‘E’ for Fail, and ‘W’ for Withdraw), provides a detailed breakdown of students' course grade outcomes for the academic years 2018-19, 2019-20, and 2020-21 at U of A. This data set includes 35,697 course observations, each with 23 variables related to enrollment and grade outcomes. The second data set, known as the Course Attributes data set, focuses on course attributes during the academic years 2019-20 and 2020-21 at U of A. Regrettably, data for the academic year 2018-19 could not be obtained for this study. This set encompasses over 260,000 course observations, each with 27 variables.
Exploratory Data Analysis
The exploratory data analysis (EDA) first assessed data shapes and decided which columns to use within each dataset, then calculated summary statistics for data distributions and outliers. More specifically, for the DEW rates dataset, we limited our scope to Spring and Fall semesters, excluding Winter and Summer. We concentrated on the five colleges with the highest enrollments due to significant course enrollment disparities among colleges. Our EDA then calculated average enrollments and DEW rates for courses, where we observed a decrease in DEW outcomes in Spring 2020, followed by an increase in Fall 2020. Then, we looked at the total student enrollment and the total D, E, and W grade counts for each selected college per semester. To avoid skew from courses with high enrollments, we shifted from total DEW counts to percentages. In the course attributes dataset, following similar EDA steps, we examined courses by the time of day, time of the week, delivery modality, and session length across selected colleges. After this, we decided to limit session length to only consider Regular Session, First Half Session, and Second Half Session in further analysis. The delivery mode was limited to exclude InteractTV mode and the weekdays were limited to be Monday through Friday.
Anomaly Detection
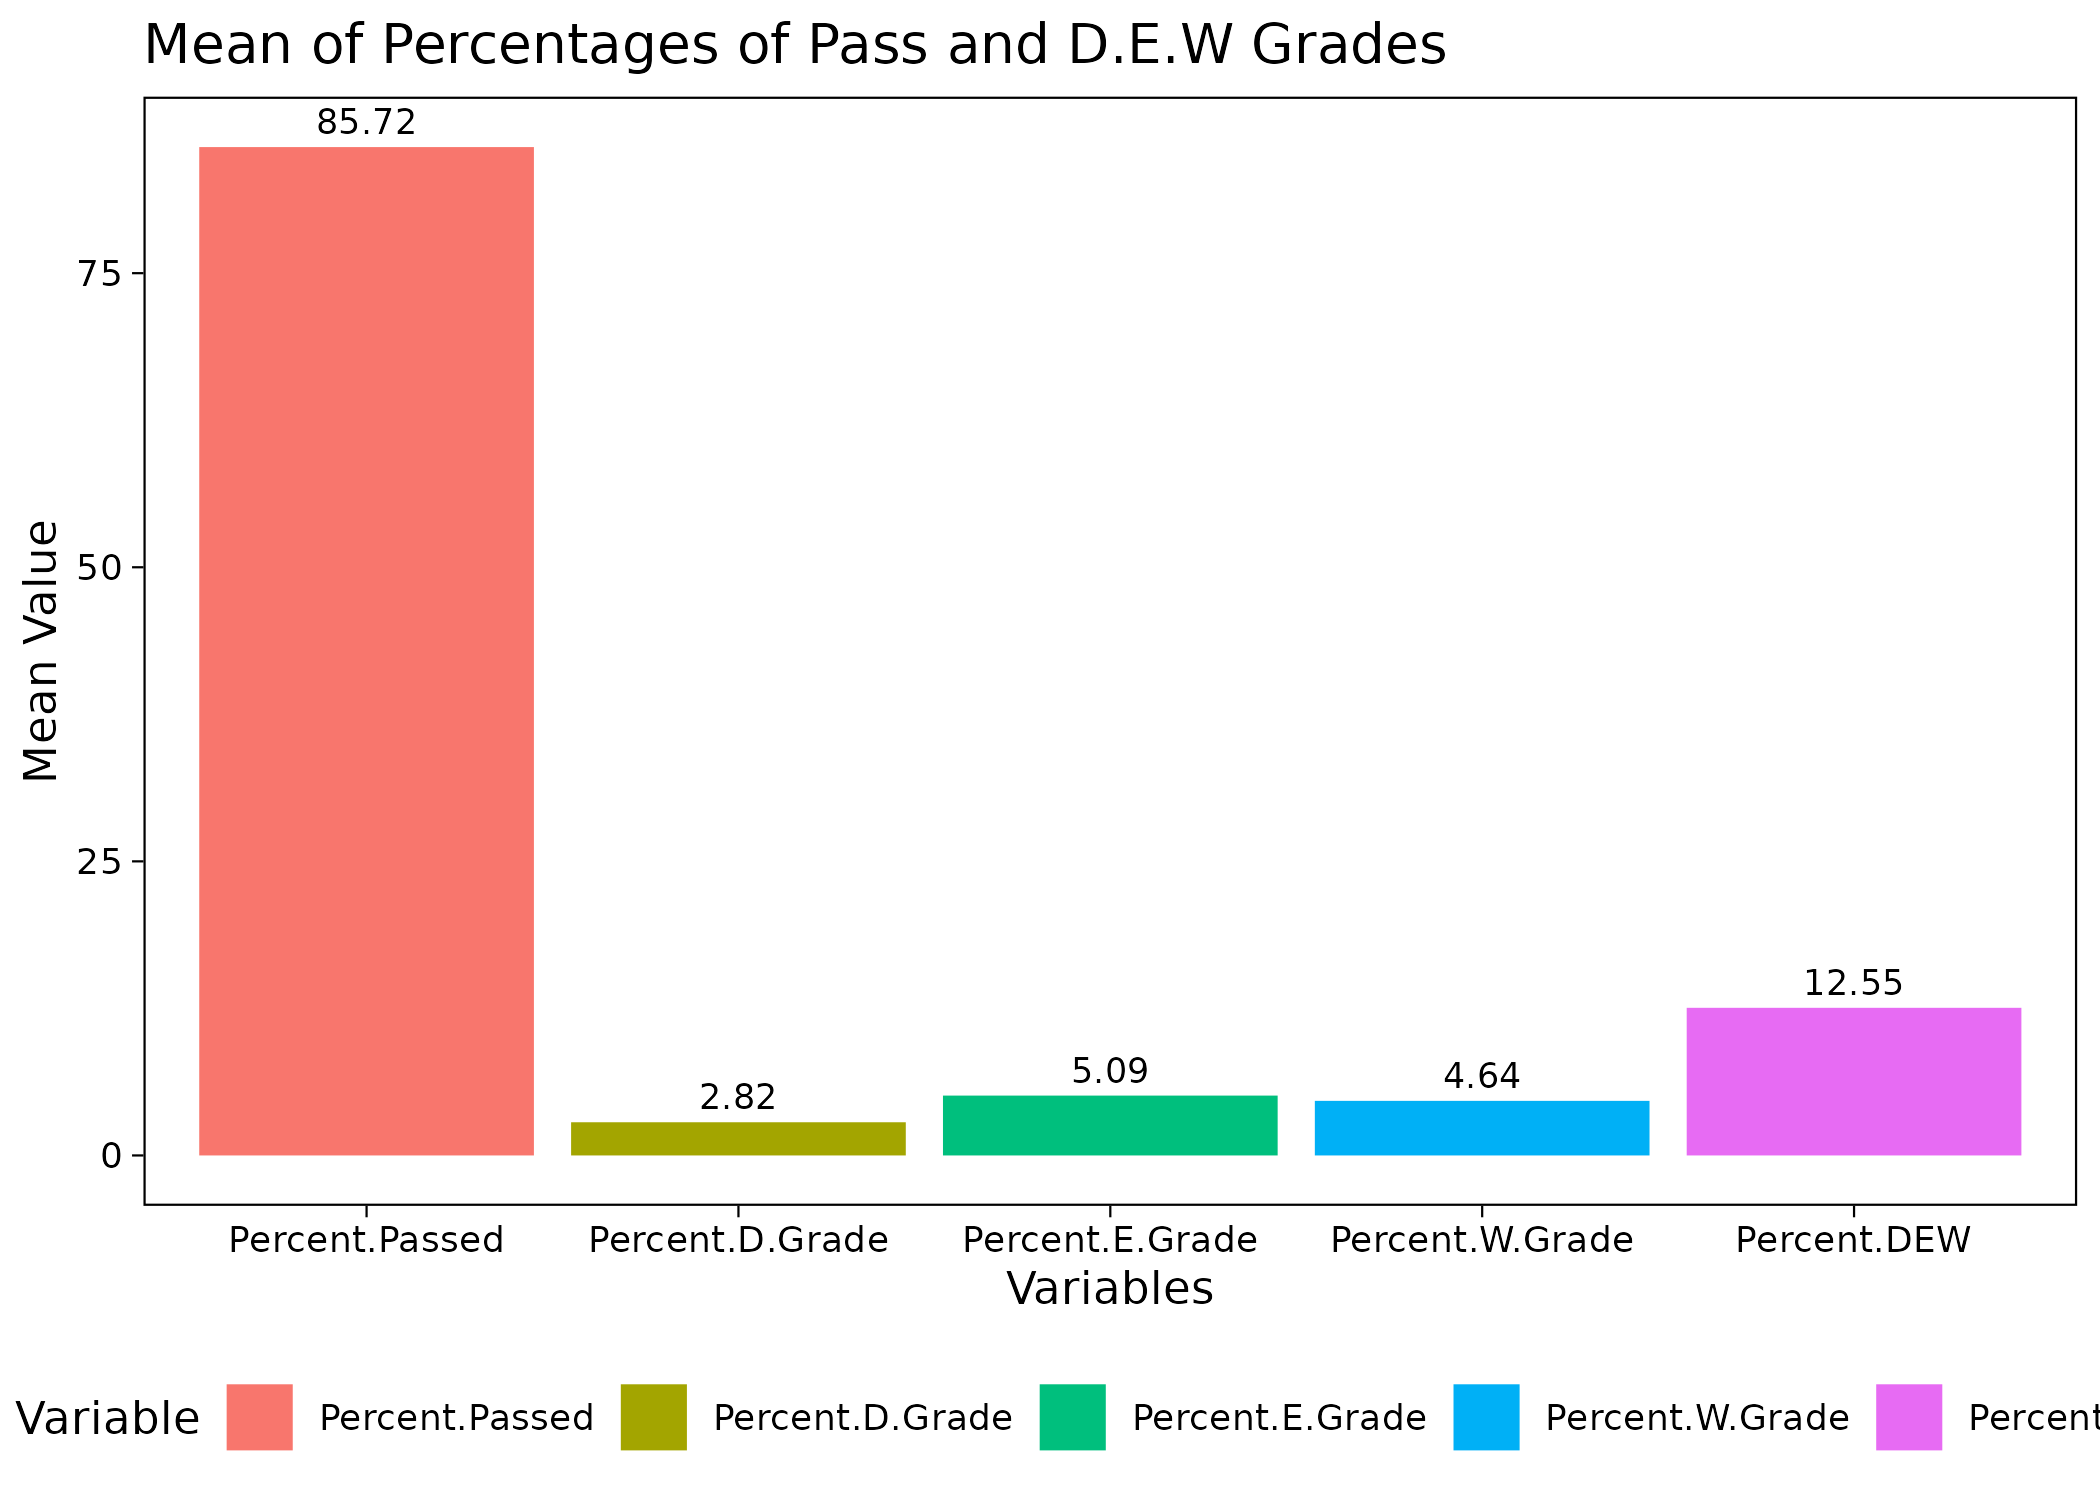
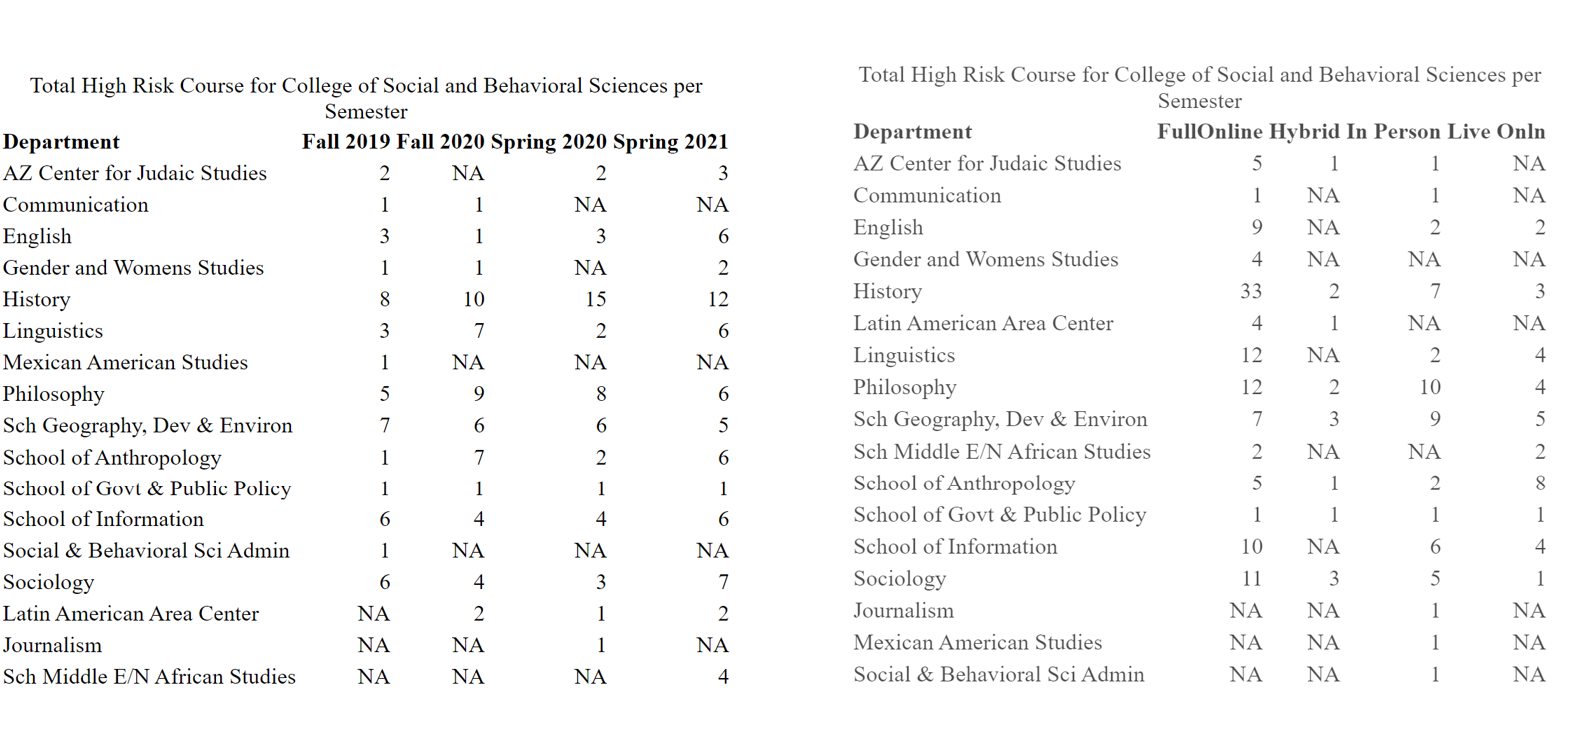
To identify patterns and trends in grade outcomes,an anomaly detection first needed to be performed. The decision was made to use the combined percentage of D, E, and W grade outcomes for courses. This was based on the wide range of total enrollments that occurred within courses as certain general education courses had enrollment in the thousands while major specific courses had enrollment in the single digits. In order to normalize these counts for analysis, the percentage value of the D,E, and W was created. The next step was to identify the quartiles of these percentages. The mean value was 12.55% of students receiving a D, E, or W grades. The first quartile occurred at 4% and the third quartile occurred at 18.2%. Box plots were then performed for each college and modality of courses. All plots indicated that instances of 30% or more of students receiving a D, E, or W grades should be considered as an outlier, with the most extreme outliers occurring at over 60%. A total of 528 courses or roughly 8% of courses in the cleaned data were isolated as having a greater than 30% DEW. The College of Social and Behavioral Sciences had the most high percent DEW courses in every semester that was examined. A detailed examination of this college showed that the mode of Fully Online and Asynchronous courses observed significantly more high DEW percentage courses than all other forms of modality or time of day.
Time Series Analysis
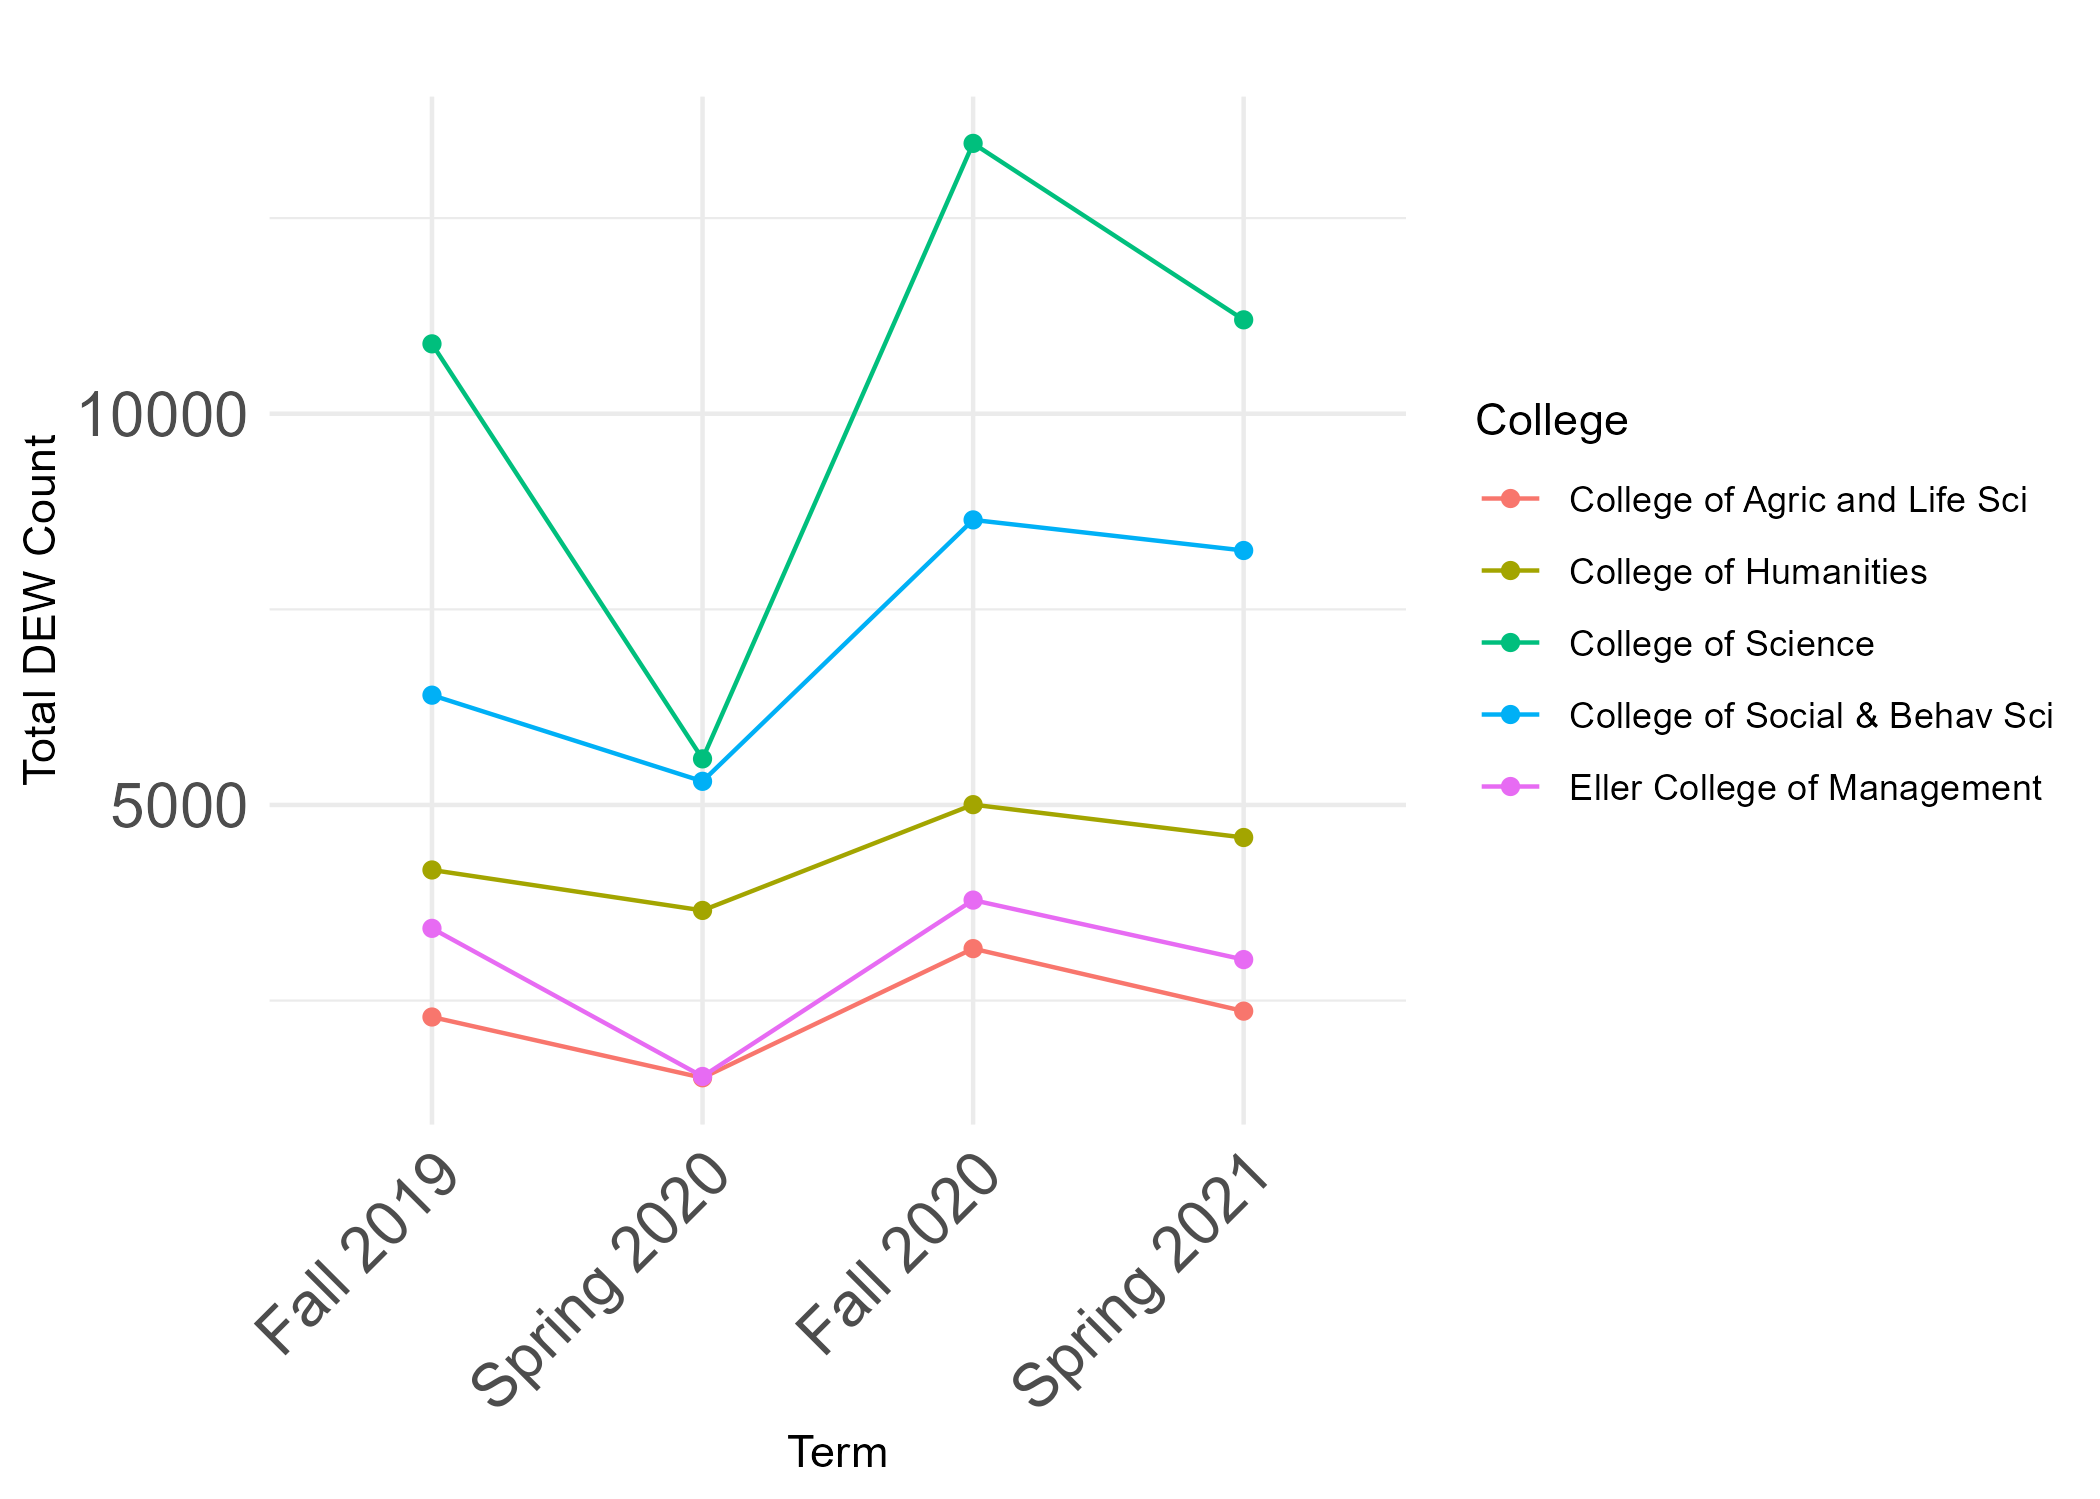
The time series analysis started with analyzing changes in DEW grades over each semester. A notable insight was the fluctuation in DEW grades which observed a decline to their lowest levels in Spring 2020 followed by an increase to their highest levels in Fall 2020.
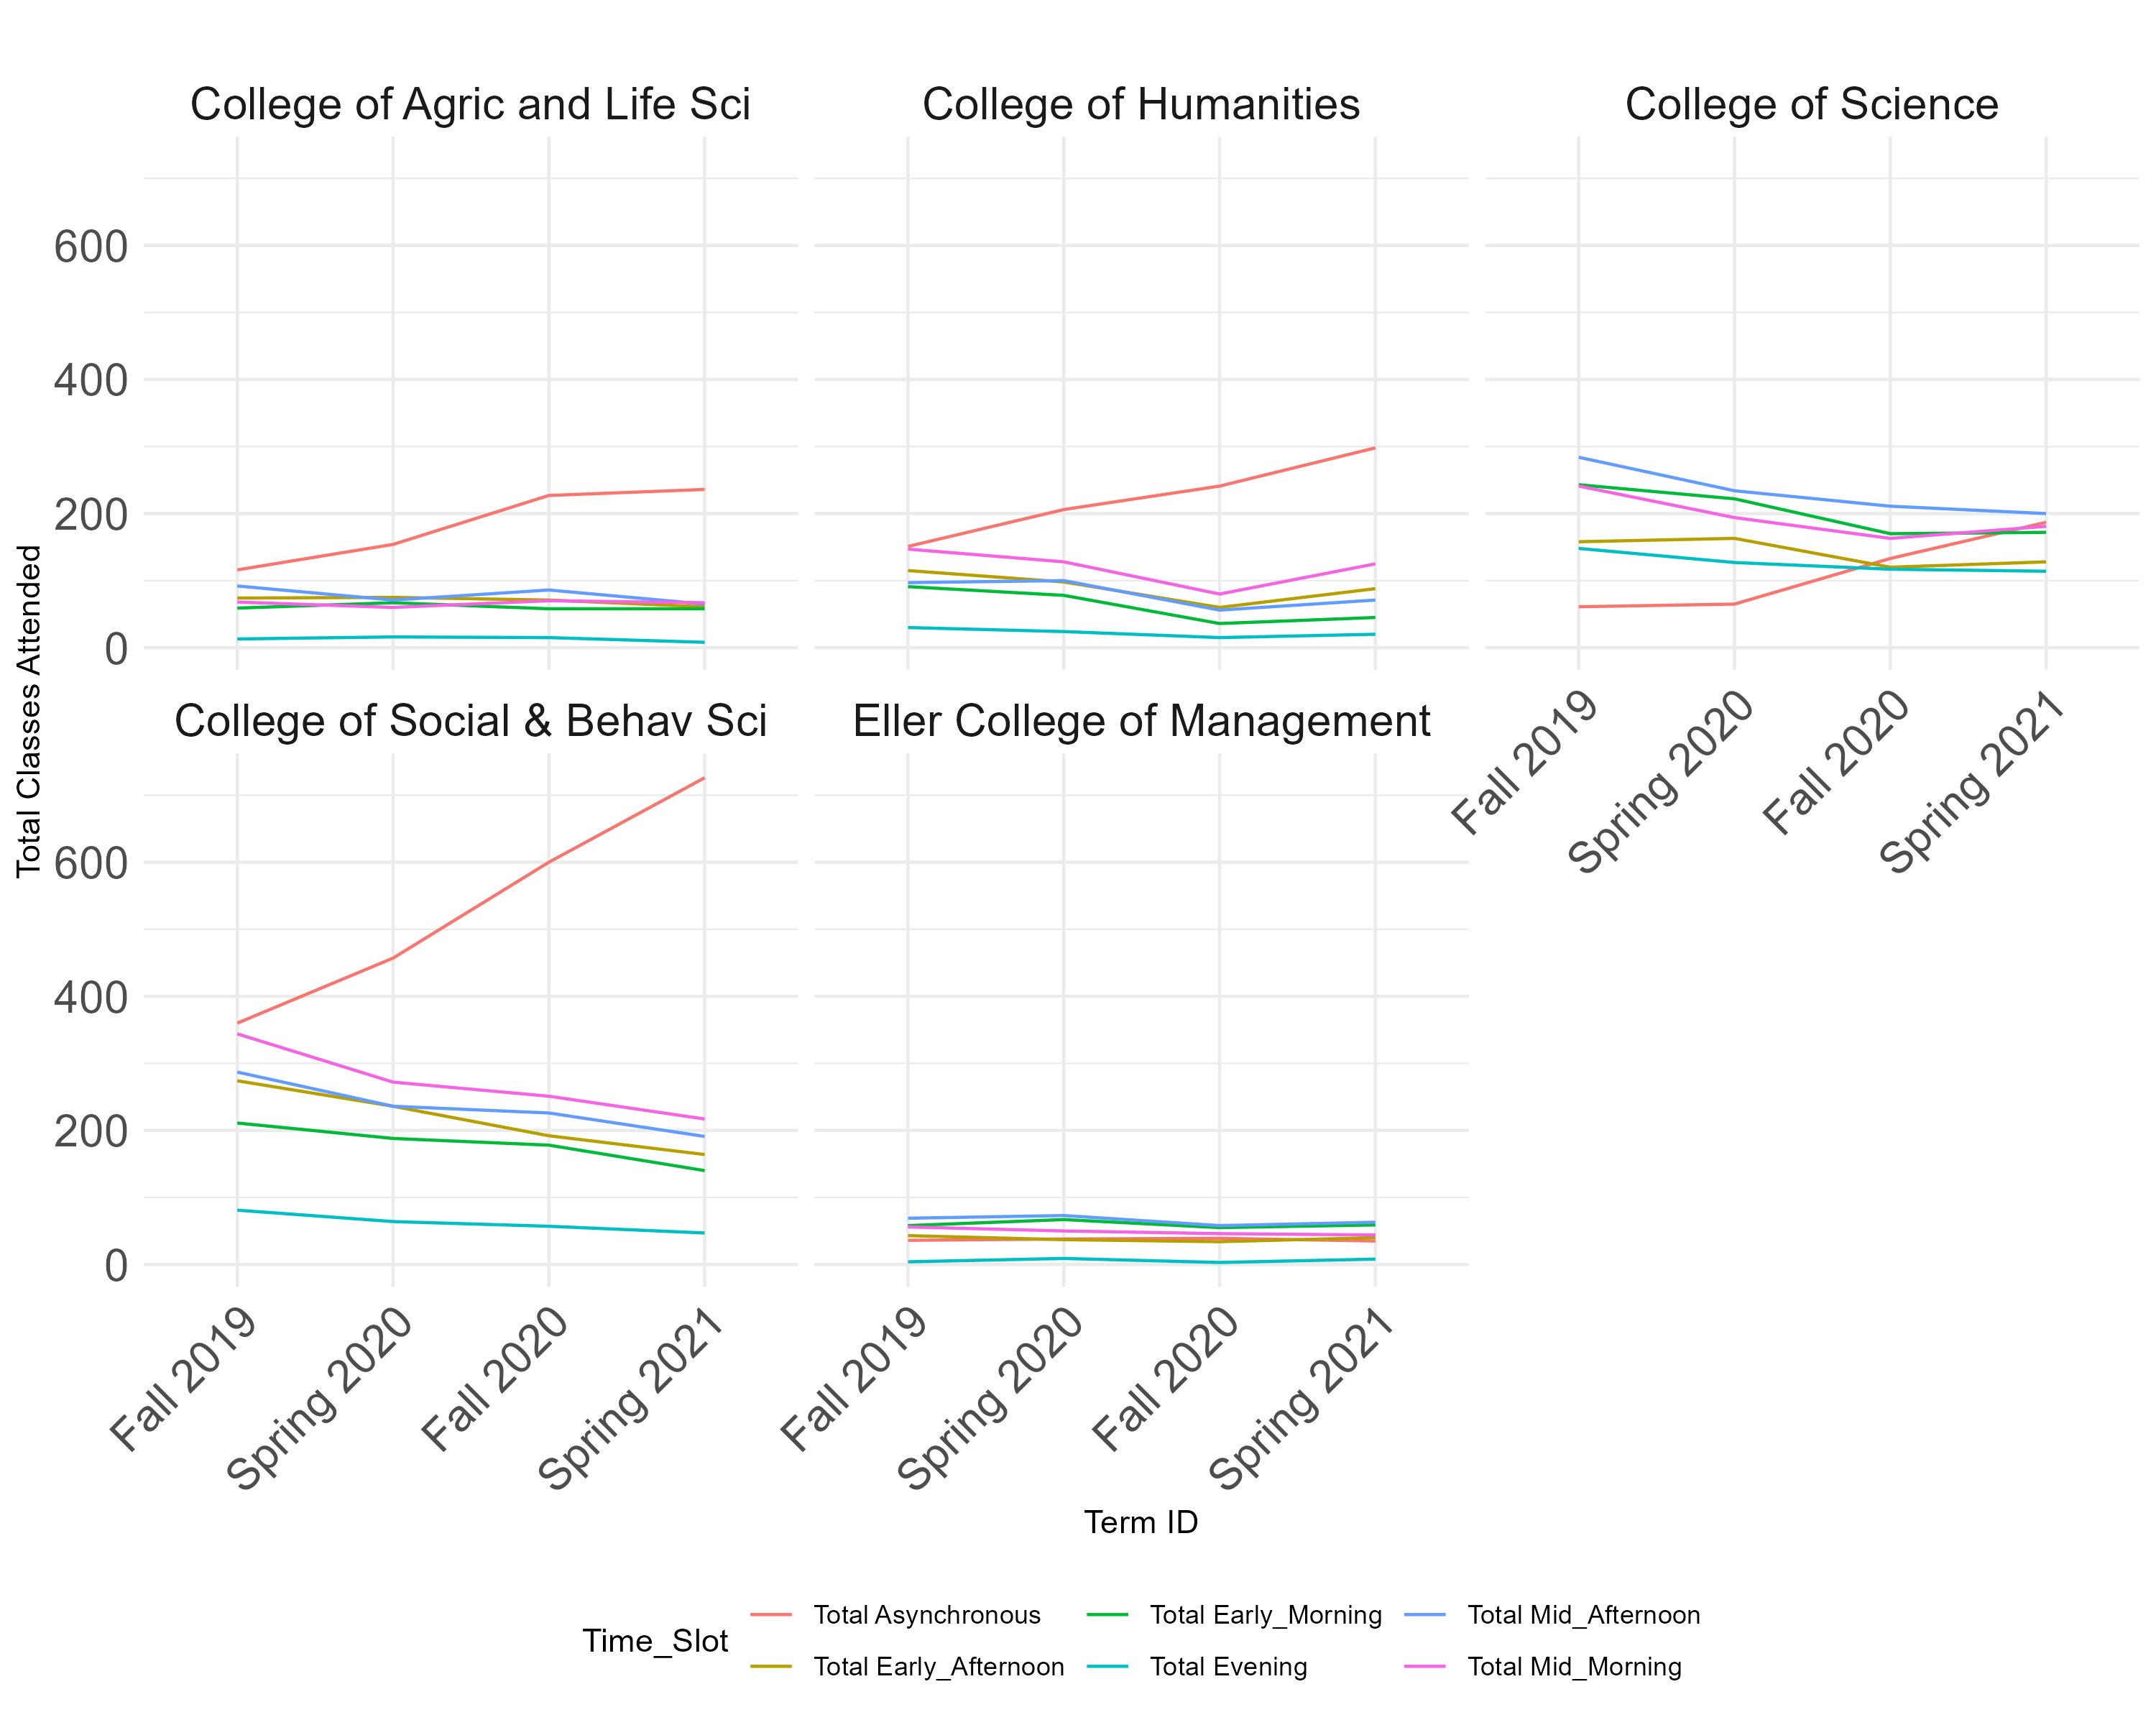
Instances of E grade outcomes were more prevalent across all colleges compared to other grades. The time series analysis of course offerings for lower and upper division classes showed the College of Humanities and the College of Science demonstrated similar rates, but the other colleges had more courses in the upper division. Next, we visualized course offerings during different times of the days and asynchronous classes. This showed that asynchronous courses were more prevalent than traditional in-person courses, particularly in the College of Social and Behavioral Sciences. Examining course offerings across weekdays showed that fewer classes were scheduled on Fridays across all colleges. A recent decline in class offerings was observed across all days of the week along with an increase in fully online courses.
Decision Tree Analysis
Considering the nature of the data, the decision tree analysis focused on single-section classes only. The DEW count was labeled into two groups: High DEW score and Low DEW score, based on the mean value of DEW percent. Our decision tree considered three main attributes:
Mode: Reflecting the modality of the class, encompassing options such as full online, in person, hybrid, or live online.
Weekday: Identifying the specific day on which classes took place, seeking potential correlations between weekdays and DEW percentages.
Time of the class: Categorized into distinct time slots, including early morning, mid-morning, early afternoon, mid-afternoon, evening, or asynchronous.
The decision tree revealed that the most significant factor influencing DEW rates was whether the class was fully online or not. If the probability of a class being fully online was greater than 0.5, there was a greater likelihood of the class having a high DEW percentage. Other attributes such as weekday and class timing did not play a significant role, and the tree did not further split based on these factors.
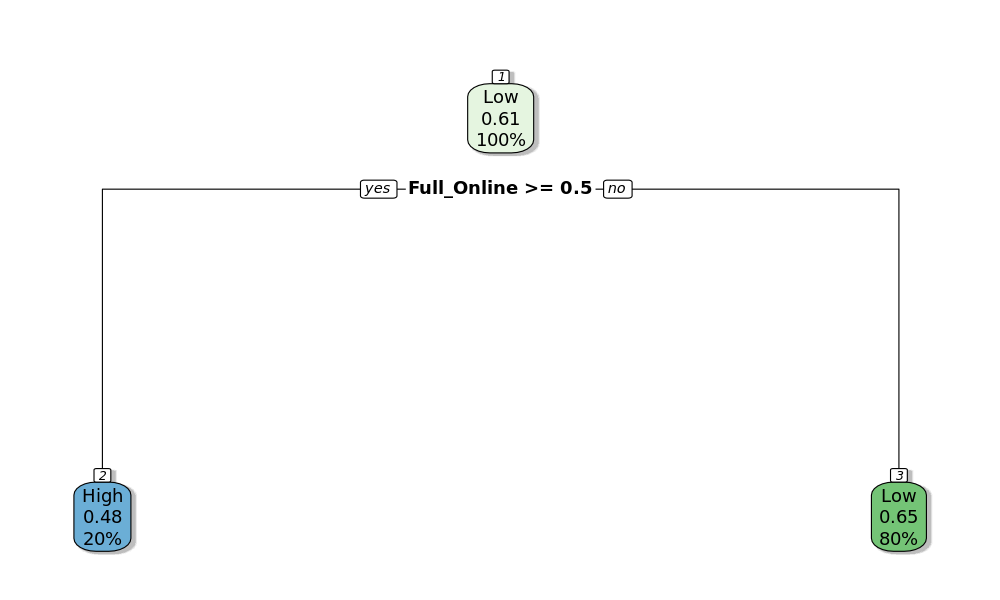
This analysis provided insights into the impact of class modality on DEW percentage. Unfortunately, due to time constraints, we were unable to generate additional decision trees by excluding the fully online attribute to explore the influence of other factors. Future analysis may want to focus on attributes associated with in-person courses and exclude the modality of fully online and asynchronous.
Regression Analysis
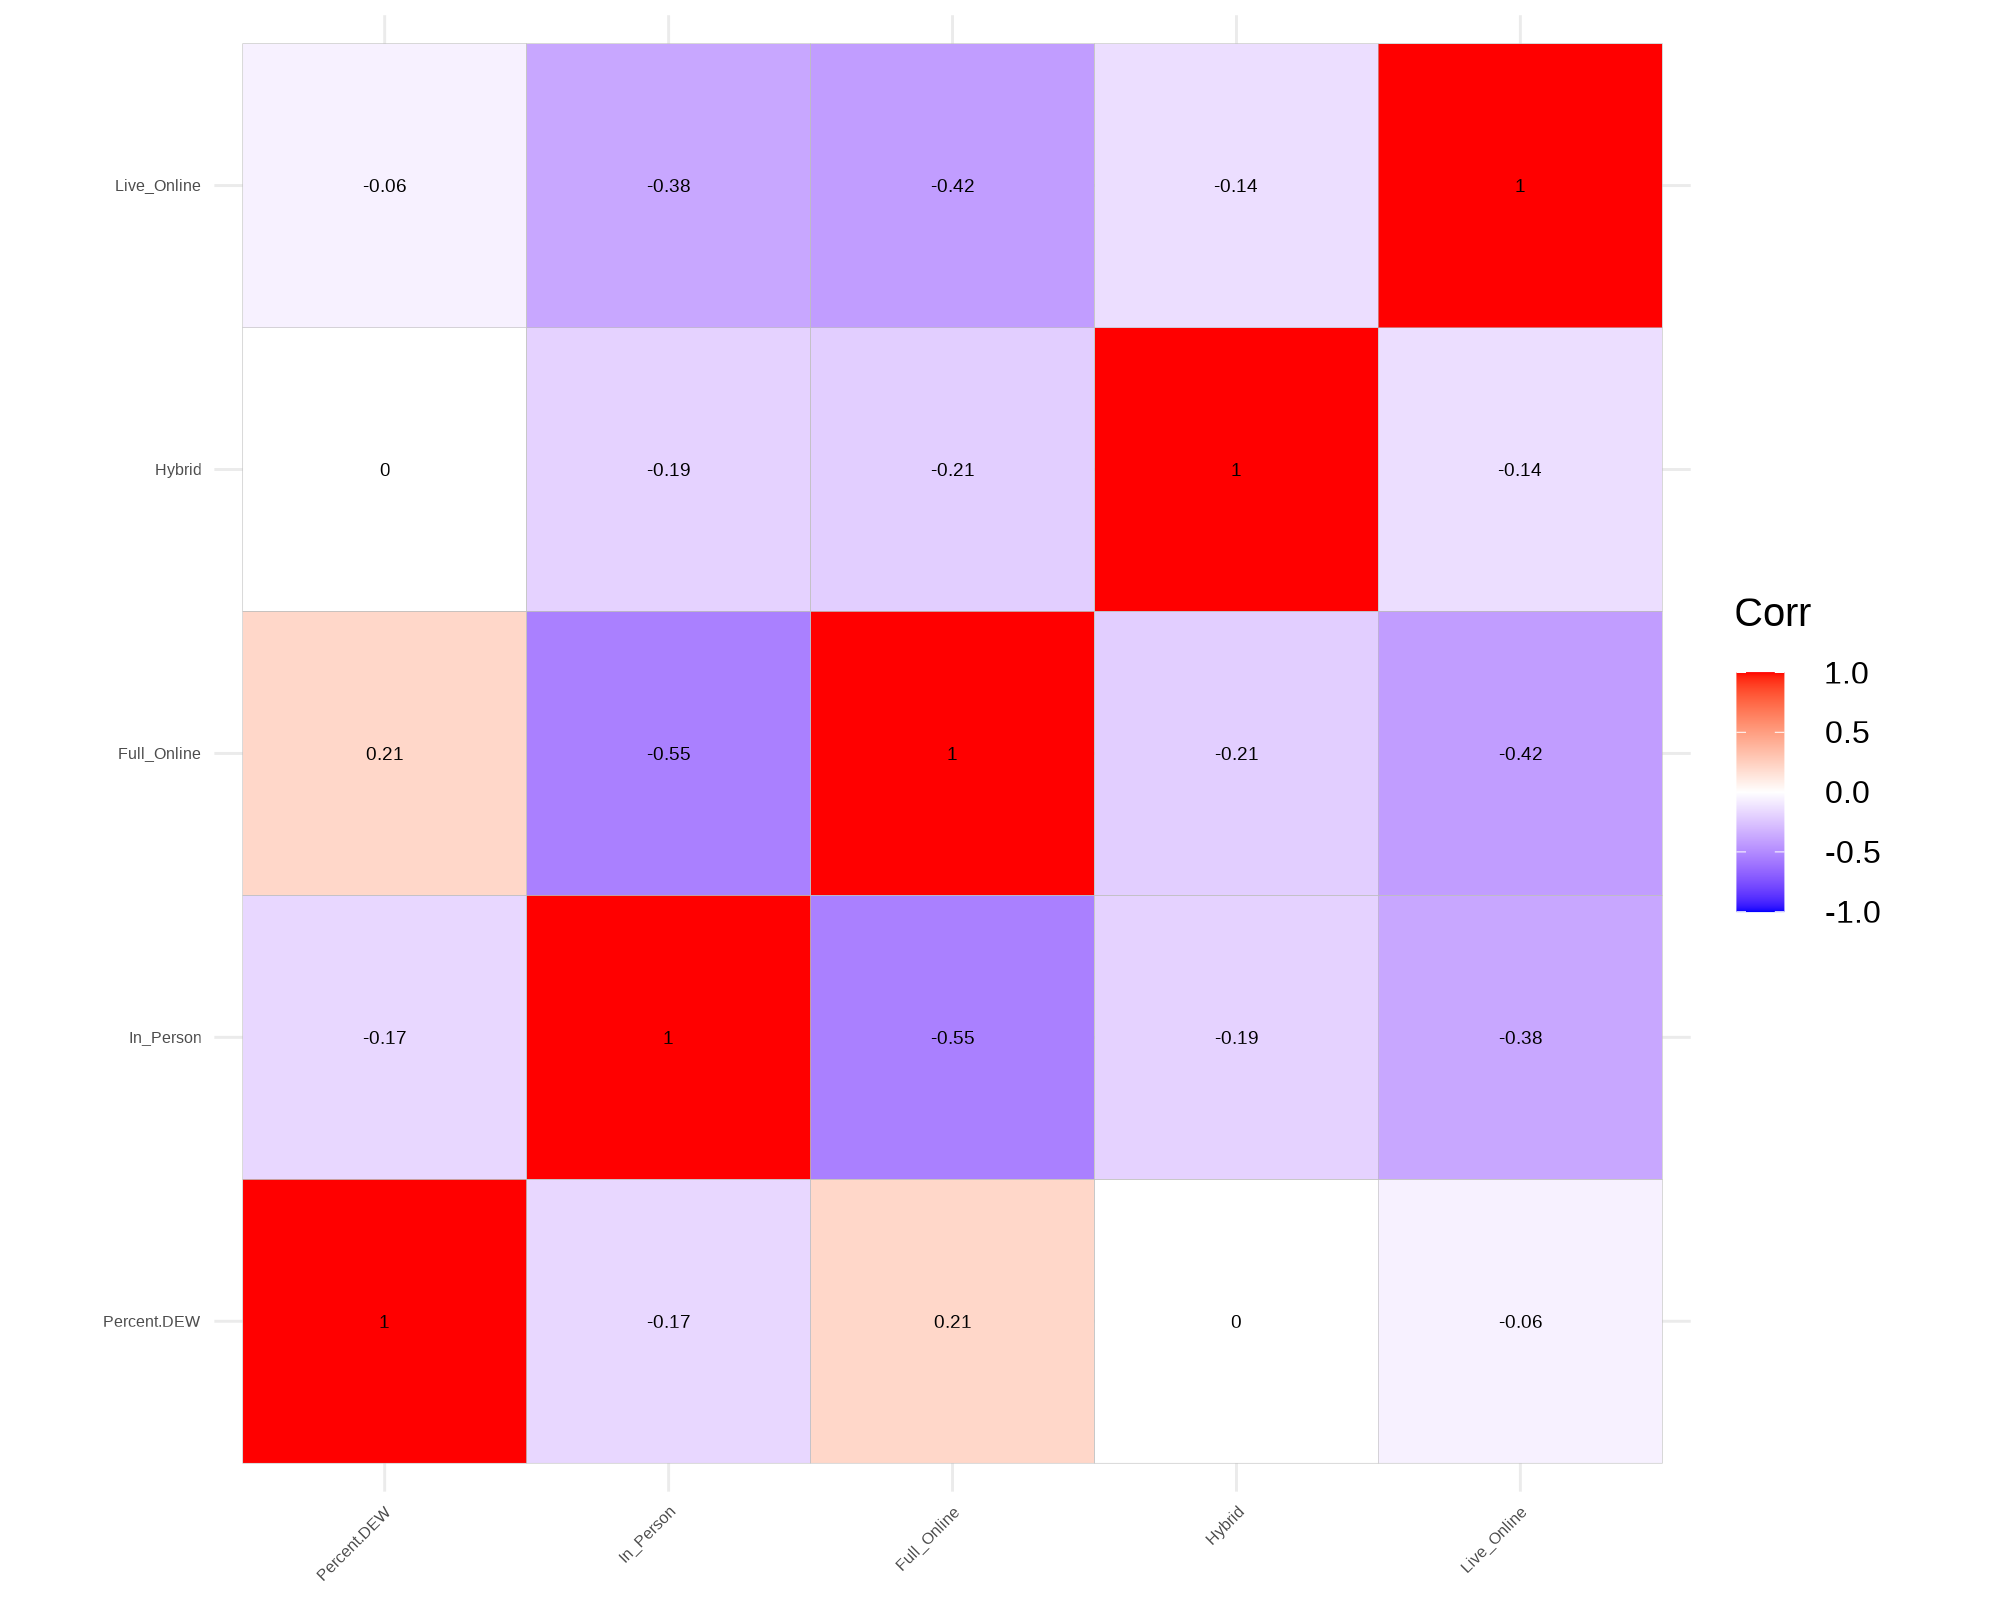
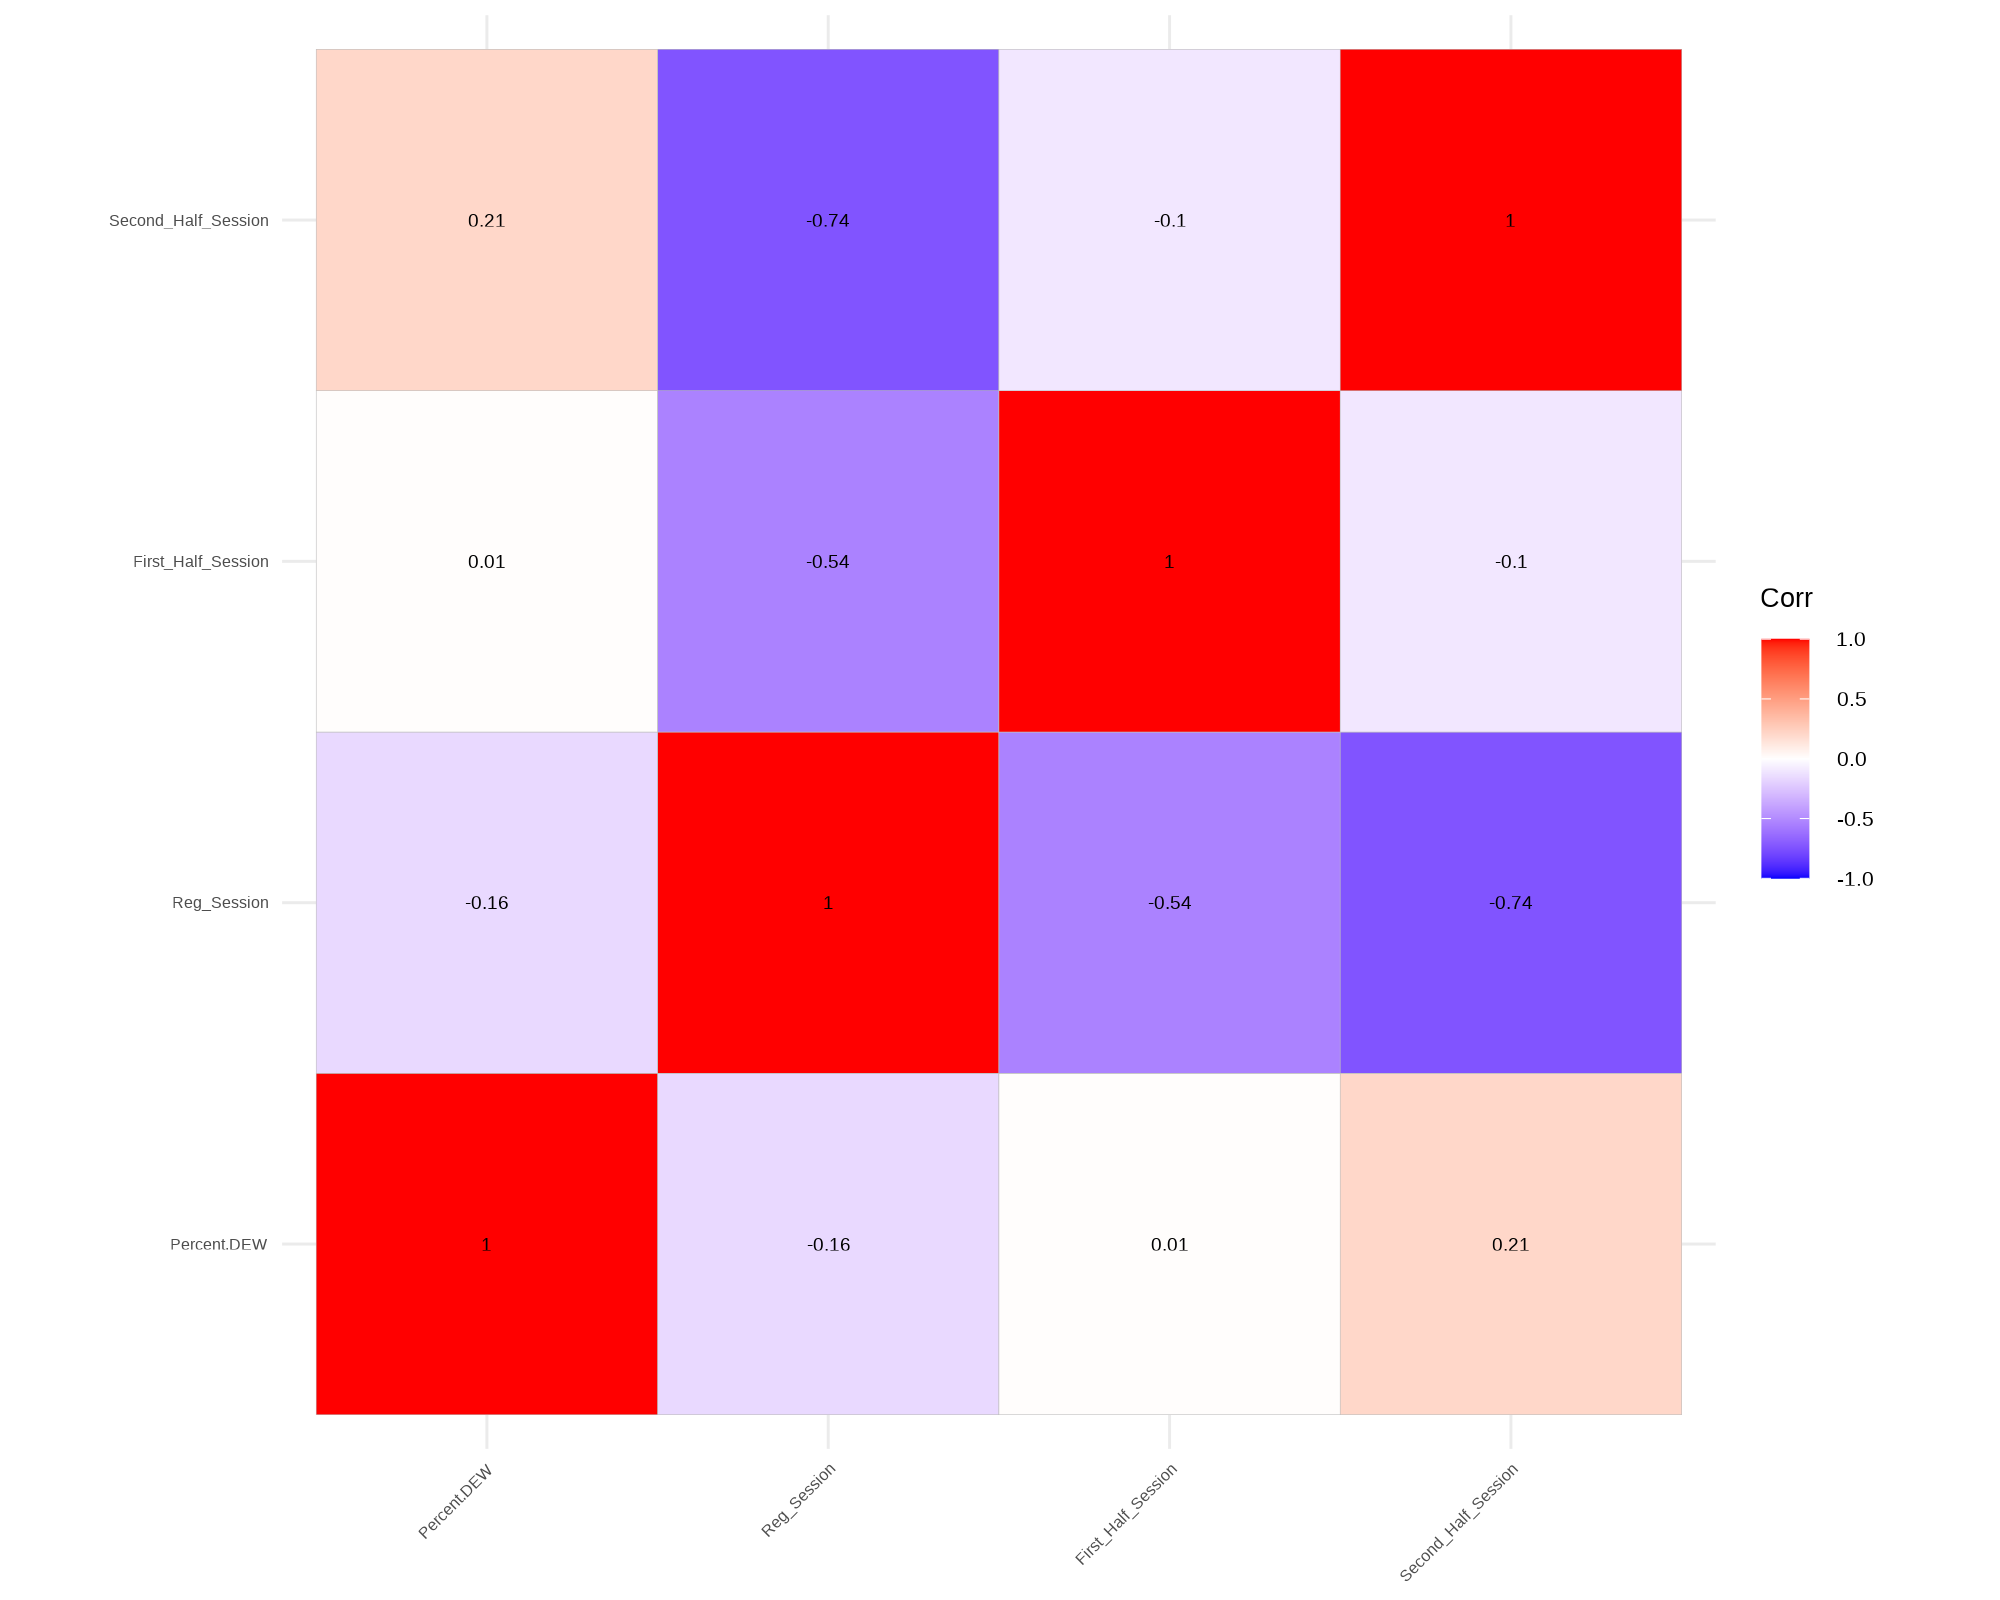
The regression analysis concentrated on the College of Social and Behavioral Sciences. The data was filtered of irrelevant columns and normalizing numeric data for feature selection purposes. Correlation tables were constructed to examine correlations. A positive correlation (0.21) was identified between the DEW percentage and the asynchronous course type. Positive correlations were found between DEW percentage and fully online classes as well as courses offered in the second half session of the semester. Therefore the key variables of “Full_Online,” “Second_Half_Session,” and “Percent.DEW” were selected. The model, with “Percent.DEW” as the dependent variable and “Second_Half_Session” and “Full_Online” as independent variables. Multi-linear, Lasso, and Ridge regression were applied to both training and testing data. However, none of the models performed well with accuracies of less than 4%. The coefficients for the Lasso and Ridge models found on the training data that DEW percentages were likely to increase by roughly 1.5% for fully online classes and an additional 1.4% if the course was offered in the second half session.
Conclusion
In conclusion, this report comprehensively covers the essential aspects of our data analysis, utilizing two datasets: the DEW Rates and the Course Attributes datasets, to examine and comprehend grade value outcomes at the University of Arizona before, during, and after the COVID-19 pandemic. Anomaly detection indicated that the College of Social and Behavioral Sciences observed the greatest number of high DEW percentage courses. A time series analysis indicated that the lowest DEW percentages were observed during the first semester of the pandemic followed by the highest levels of DEW percentage courses in the next semester. A decision tree analysis found that fully online courses are a key factor in determining whether a course will be above average for the DEW percent. A regression analysis found a correlation between the DEW percent and fully online classes as well as classes offered in the second half session of a semester. An accurate predictive model was unable to be constructed during the course of this study. However, future research that extends the timeframe of the data and includes more fine-grained data could yield further insights regarding relationships between grade value outcomes and course attributes.